International Development Association
Management’s Discussion & Analysis
and
Financial Statements
June 30, 2022

Contents
Section I: Executive Summary
Section II: Overview
Section IV: Financial Results
Section V: Development Activities, Products
and Programs
Section VI: Other Development Activities and
Programs
Section VII: Investment Activities
Section VIII: Borrowing Activities
Section IX: Risk Management
Section X: Critical Accounting Policies and the
Use of Estimates
Section XI: Governance and Internal Controls
Appendix
Summary of Financial Results 4
Presentation 6
Introduction 6
Twentieth Replenishment of Resources (IDA20) 6
Financial Business Model 6
Basis of Reporting 7
IDA19 Funding 8
IDA20 Funding 9
Allocation of IDA20 Resources 9
Financial Results and Portfolio Performance 15
Lending Framework 24
Financial Terms 25
Loans, Grants and Guarantee Activity 27
Guarantees 29
Other Financial Products and Services 30
Grant Making Facilities 30
Debt Relief 30
Externally-Funded Activities 30
Investments Trading Portfolio 33
Investments - Non-Trading Portfolio 34
Concessional Partner Loans 35
Market Debt 35
Other Short-Term Borrowings 36
Contractual Obligations 36
Risk Governance 37
Risk Oversight and Coverage 37
39
Fair Value of Financial Instruments 49
Provision for Losses on Loans and Other Exposures 49
Provision for HIPC Debt Initiative and MDRI 49
Business Conduct 50
General Governance 50
Audit Committee 51
External Auditors 52
Senior Management Changes 52
Internal Controls 52
Glossary of Terms 53
List of Tables, Figures and Boxes 54

Section I: Executive Summary
2 June 30, 2022
This Management’s Discussion & Analysis (MD&A) discusses the results of the International Development
Association’s (IDA) financial performance for the fiscal year ended June 30, 2022 (FY22). IDA undertakes no
obligation to update any forward-looking statements. Certain reclassifications of prior years’ information have been
made to conform with the current year’s presentation. For discussion of IDA’s financial results for the year ended
June 30, 2021, as compared to the year ended June 30, 2020, see Section IV – Financial Results in IDA’s MD&A and
Financial Statements for the fiscal year ended June 30, 2021 (FY21). For information relating to IDA’s development
operations’ results and corporate performance, refer to the World Bank Corporate Scorecard and Sustainability
Review.
Box 1: Selected Financial Data
In millions of U.S. dollars, except ratios which are in percentages
As of and for the fiscal years ended June 30,
2022
2021
2020
Lending Highlights (Sections IV & V)
Loans, Grants and Guarantees
Net commitments
a
$
37,727
$
36,028
$
30,365
Gross disbursements
a
21,214
22,921
21,179
Net disbursements
a
14,477
16,465
15,112
Balance Sheet (Section IV)
Total assets
$
220,014
$
219,324
$
199,472
Net investment portfolio
b
39,561
37,921
35,571
Net loans outstanding
174,490
177,779
160,961
Borrowing portfolio
c
35,032
28,335
19,653
Total equity
178,668
180,876
168,171
Income Statement (Section IV)
Interest revenue, net of borrowing expenses
$
1,901
$
1,996
$
1,843
Transfers from affiliated organizations and others
274
544
252
Development grants
(2,372)
(2,830)
(1,475)
Net income (loss)
12
(433)
(1,114)
Non-GAAP Measures:
Adjusted Net Income (Section IV)
$
260
$
394
$
724
Deployable Strategic Capital Ratio (Section IX)
26.4%
30.4%
35.8%
a. Commitments that have been approved by the Executive Directors (referred to as “the Board” in this document) and are net of full
cancellations / terminations approved in the same fiscal year. Commitments and disbursements exclude IDA-IFC-MIGA Private
Sector Window (PSW) activities.
b. For composition of the net investment portfolio, see Notes to the Financial Statements, Note C – Investments – Table C2.
c. Includes associated derivatives.

Section I: Executive Summary
June 30, 2022 3
Section I: Executive Summary
IDA, an international organization owned by its 174
1
member countries, is one of the five institutions of the World
Bank Group (WBG
2
). Each WBG organization is legally and financially independent from IDA, with separate assets
and liabilities. IDA is not liable for the obligations of the other institutions.
IDA is rated triple-A by the major rating agencies and has been providing financing and knowledge services to many
of the world’s developing countries for more than 61 years. With its many years of experience and its depth of
knowledge in the international development arena, IDA plays a key role in achieving the WBG’s goal of helping
countries achieve better development outcomes. IDA contributes to the WBG’s twin goals of ending extreme poverty
and promoting shared prosperity by providing loans, grants, and guarantees, and other financial products to the poorest
and most vulnerable countries to help meet their development needs and by providing technical assistance and policy
advice leveraging its experience and expertise. It also supports countries with disaster risk financing and insurance
against natural disasters and health related crises and facilitates financing through trust fund partnerships.
IDA and its affiliated organizations seek to help countries achieve improvements in growth, job creation, poverty
reduction, governance, the environment, climate adaptation and resilience, human capital, infrastructure, and debt
transparency, among others. To meet its development goals, the WBG has been increasing its focus on country
programs in order to improve growth and development outcomes. Further, the last fiscal year brought new challenges
to the global outlook – high inflation and the rise in food insecurity that came on top of growing inequality, global
fragility, the coronavirus disease (COVID-19) pandemic and other geopolitical events, rising debt, and
macroeconomic imbalances. In response, IDA, as part of the WBG efforts, continues to work with partners at global
and country levels to support its borrowing countries in addressing the impact of these multiple crises, to enhance
resilience, and lay the groundwork for rebuilding better. The responses all remain in compliance with IDA’s existing
financial, operational and risk management policies.
The nineteenth replenishment of IDA (IDA19), which ended in FY22, built on the strong momentum of the IDA18
financing framework by combining contributions from members with market borrowings. IDA’s hybrid financial
model has allowed IDA to significantly expand its financial capacity and provide $72 billion in financing for its clients
from the IDA19 replenishment.
On March 31, 2022, IDA’s Twentieth Replenishment (IDA20) was approved by the Board of Governors. In April
2021, members agreed to launch IDA20 one year early, to commence in FY23, and to shorten IDA’s Nineteenth
Replenishment (IDA19) implementation period to two years (FY21-FY22). The IDA20 operational and financing
framework will continue to leverage IDA’s strong equity base to help low-income countries respond to the COVID-
19 crisis and build a greener, more resilient, and inclusive future. Members agreed to a financing envelope of $93
billion
3
over the three-year replenishment period, FY23-FY25, supported by $23.5 billion of member contributions.
See Section III: IDA’s Financial Resources.
1
On November 3, 2021, Bulgaria became the 174
th
member country of IDA.
2
The other WBG institutions are the International Bank for Reconstruction and Development (IBRD), the International Finance
Corporation (IFC), the Multilateral Investment Guarantee Agency (MIGA), and the International Centre for Settlement of Investment
Disputes (ICSID). The World Bank consists of IBRD and IDA.
3
U.S. dollar amounts are based on IDA20 reference rate of USD/SDR 1.42934. The U.S. dollar amounts are provided for reporting
purposes only, as IDA’s balance sheet is predominantly managed in Special Drawing Rights (SDR).
Section I: Executive Summary
4 June 30, 2022
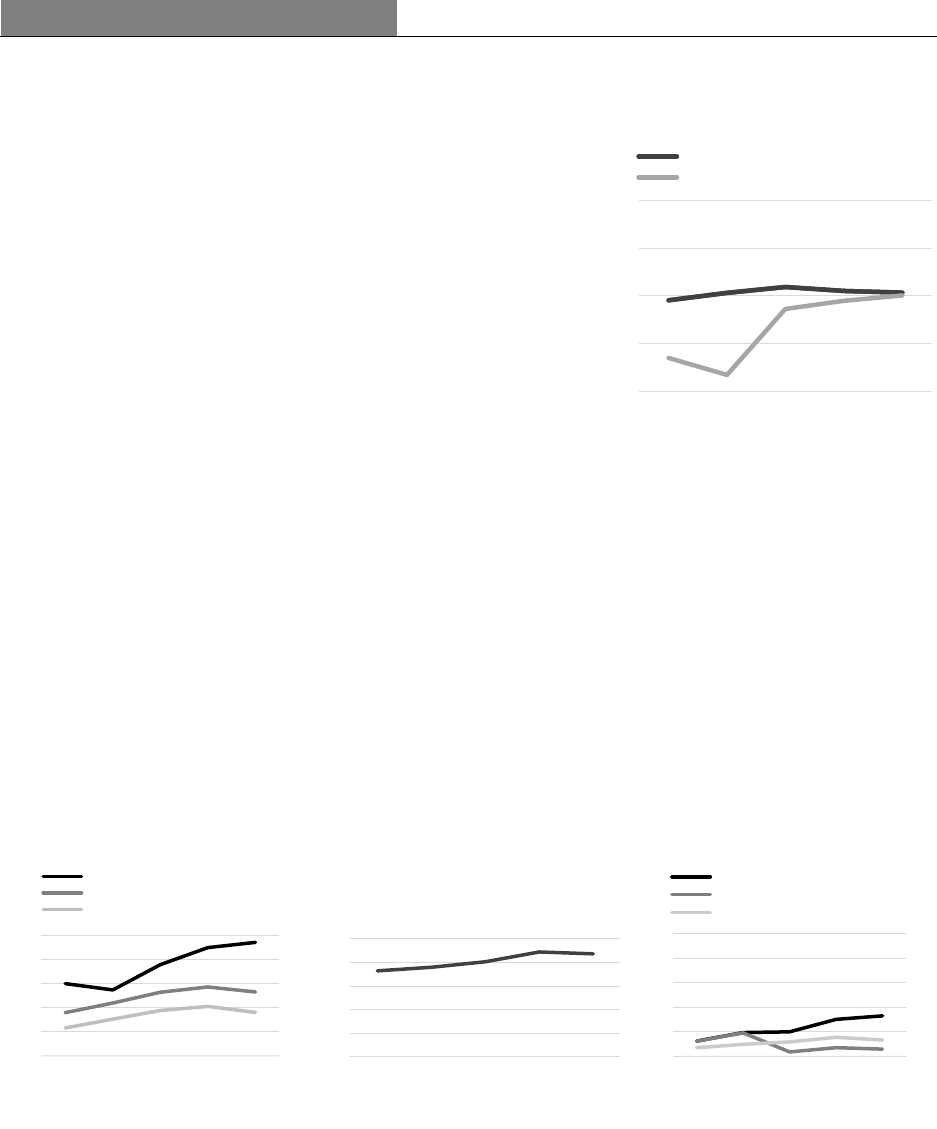
Summary of Financial Results
Net Income and Adjusted Net Income
Net Income: IDA reported net income of $12 million in FY22,
compared to a net loss of $433 million in FY21. The increase was
primarily driven by non-functional currency translation adjustments
and the decrease in development grant expenses, partially offset by
the increase in the provision for losses on loans and other exposures.
See Section IV: Financial Results.
Adjusted Net Income: IDA’s adjusted net income was $260 million
in FY22, compared to $394 million in FY21. The decrease was
primarily due to lower interest revenue on loans and higher net non-
interest expenses. See Section IV: Financial Results.
In millions of U.S. dollars
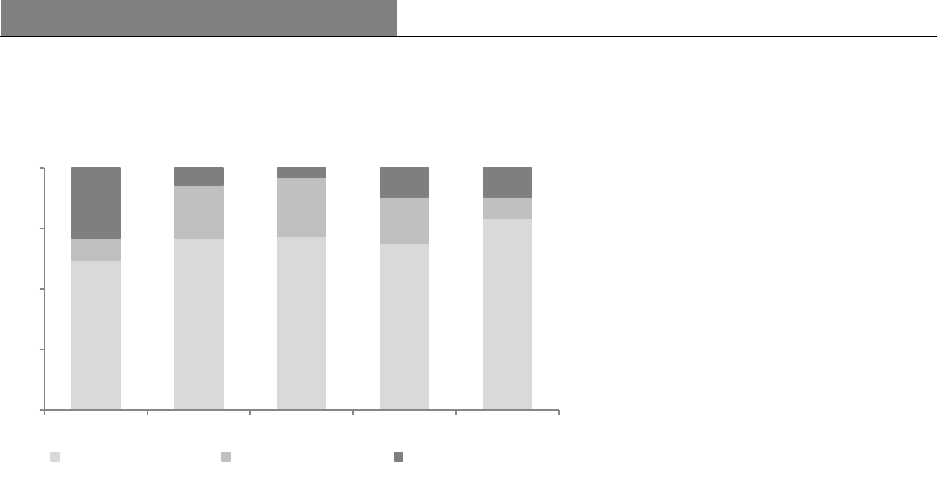
Lending Operations
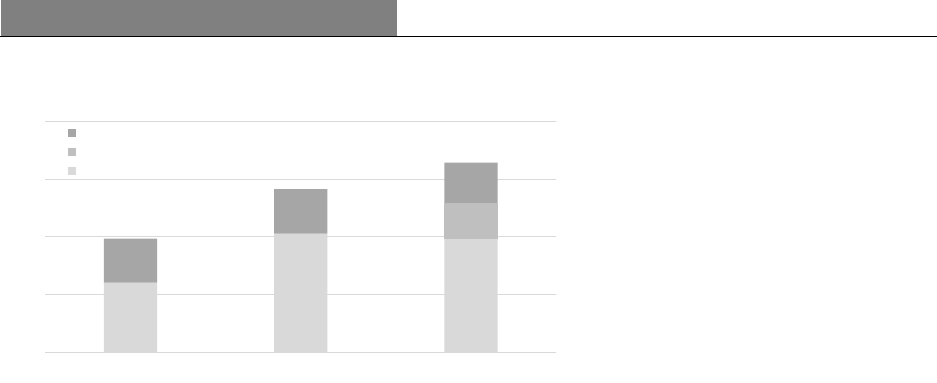
IDA’s net commitments in FY22 were $37.7 billion, 5% higher than FY21 and the highest annual level in IDA’s
history. Out of the total net commitments, $24.5 billion were loan commitments and $13.2 billion were grant
commitments. FY22 commitments reflected continued support for COVID-19 related efforts, including $2.3 billion
of financing for COVID-19 vaccines and $3.7 billion of financing for food security. In addition, FY22 commitments
included $1 billion financing to provide fast-disbursing support for Ukraine on an exceptional basis.
IDA’s net loans outstanding decreased by $3.3 billion, from $177.8 billion as of June 30, 2021, to $174.5 billion as
of June 30, 2022, primarily due to currency translation losses as the SDR depreciated against the U.S. dollar, partially
offset by net loan disbursements during the year. See Section IV: Financial Results.
Development grant expenses were $2.4 billion in FY22 compared to $2.8 billion in FY21. The development grant
activity volume in FY22 was higher than FY21, excluding grants of $1.3 billion disbursed to Sudan in the previous
year after its arrears were cleared in March 2021. The decrease in development grant expenses from FY19 to FY20,
as shown in the graph below, is due to the timing of the recognition of the grant expenses as a result of the
implementation of a new accounting standard in FY20.
In billions of U.S. dollars
a. Includes loans, grants, and guarantees.
(8,000)
(4,000)
0
4,000
8,000
FY18 FY19 FY20 FY21 FY22
Adjusted Net Income (Loss)
Net Income (Loss)
0
8
16
24
32
40
FY18 FY19 FY20 FY21 FY22
Net Commitments
Gross Disbursements
Net Disbursements
0
40
80
120
160
200
Jun 18 Jun 19 Jun 20 Jun 21 Jun 22
Net Loans Outstanding
0
8
16
24
32
40
FY18 FY19 FY20 FY21 FY22
Net Grant Commitments
Grant Expense
Net Grant Disbursements
a
Section I: Executive Summary
June 30, 2022 5
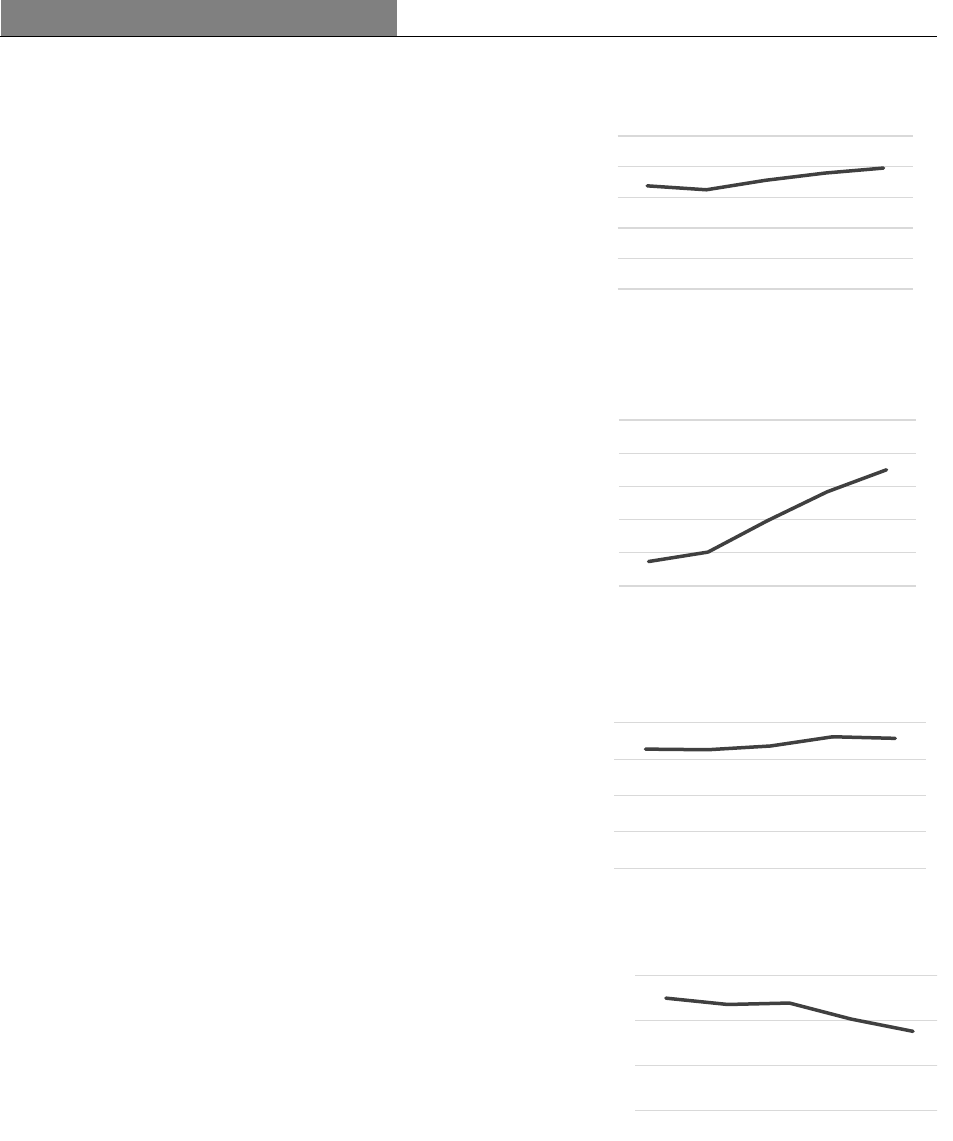
Net Investment Portfolio
As of June 30, 2022, the net investment portfolio was $39.6 billion,
compared with $37.9 billion as of June 30, 2021. See Section VII:
Investment Activities. The primary objective of IDA’s investment
strategy is principal protection. As of June 30, 2022, 74% of IDA’s
investment portfolio was held in instruments rated AA or above (See
Table 30).
In billions of U.S. dollars
Borrowing Portfolio
Market borrowings at fair value: As of June 30, 2022, the market
borrowings carried at fair value, and the related derivatives were
$21.9 billion, an increase of $1.3 billion from June 30, 2021.
Market borrowings at amortized cost: As of June 30, 2022, the
market borrowings carried at amortized cost were $6.2 billion (Nil -
June 30, 2021).
Concessional Partner Loans at amortized cost: As of June 30,
2022, total borrowings from members - Concessional Partner Loans
(CPL) were $7.0 billion, a decrease of $0.7 billion from June 30,
2021.
In billions of U.S. dollars
Equity and Capital Adequacy
As of June 30, 2022, IDA’s equity was $178.7 billion, a decrease of
$2.2 billion from June 30, 2021. The decrease was primarily due to
currency translation losses consistent with the depreciation of the
SDR against the U.S. dollar. See Section IV: Financial Results.
In billions of U.S. dollars
The Deployable Strategic Capital (DSC) ratio, IDA’s main capital
adequacy measure, was 26.4% as of June 30, 2022, above the zero
percent policy minimum and a decrease of 4.0 percentage points
from 30.4% as of June 30, 2021. IDA’s capital continues to be
adequate to support its operations. See Section IX: Risk
Management.
Ratio in percentages
0
10
20
30
40
50
Jun 18 Jun 19 Jun 20 Jun 21 Jun 22
Net Investment Portfolio
0
10
20
30
40
50
Jun 18 Jun 19 Jun 20 Jun 21 Jun 22
Borrowing portfolio
0
50
100
150
200
Jun 18 Jun 19 Jun 20 Jun 21 Jun 22
Equity
Policy Minimum Ratio = 0%
0%
15%
30%
45%
Jun 18 Jun 19 Jun 20 Jun 21 Jun 22
Deployable Strategic Capital Ratio

Section II: Overview
6 June 30, 2022
Section II: Overview
Presentation
This document provides Management’s Discussion and Analysis of the financial condition and results of operations
for IDA for the fiscal year ended June 30, 2022. A Glossary of Terms is provided at the end of this document.
Introduction
Generally, every three years, representatives of IDA’s members
4
meet to assess IDA’s financial capacity and the
medium-term demand for new IDA financing. Members decide on the policy framework, agree upon the amount of
financing to be made available for the replenishment period, and commit to additional contributions of equity that are
required to meet these goals. The meetings culminate in a replenishment agreement that determines the size, sources
(both internal and external), and uses of funds for the replenishment period.
Twentieth Replenishment of Resources (IDA20)
On March 31, 2022, the IDA20 Resolution was approved by IDA’s Board of Governors. IDA20 recognizes the need
to help address the profound challenges faced by IDA countries. IDA20 reaffirms the international community’s
commitment to scale up support to enable IDA countries to respond to the effects of the COVID-19 crisis, recoup their
development losses, and resume progress toward the 2030 Sustainable Development goals. IDA20 will support the
world’s poorest and most vulnerable countries to emerge on a development path in line with the Green, Resilient and
Inclusive Development (GRID) framework. IDA20 will build on the IDA19 special themes, with the continuation of
human capital, climate change, fragility, conflict, and violence (FCV), gender and development, jobs, and economic
transformation. In addition, IDA20’s policy package will incorporate four crosscutting issues: crisis preparedness,
governance and institutions, debt (including transparency), and technology.
With this agenda in the forefront, IDA members agreed on the IDA20 operational and financing framework that
reflects a financing envelope of $93 billion, over a three-year replenishment period (FY23-FY25), that will be
supported by $23.5 billion of member contributions. The remainder of the financing envelope will be covered by the
Multilateral Debt Relief Initiative (MDRI), financing raised in the capital markets, the IDA19 carry-over, internal
resources (e.g., loan repayments) and transfers from IBRD.
Financial Business Model
IDA has financed its operations over the years with its own equity, including regular additions to equity provided by
member countries as part of the replenishment process. As a result of the strong support of member countries, IDA
has built up a substantial equity base of $178.7 billion as of June 30, 2022. In FY15, IDA introduced debt to its
financial model with concessional partner loans received from certain member countries. In FY18, IDA introduced a
hybrid financing model by including market debt into its business model. By prudently leveraging its equity and
blending market debt with equity contributions from members, IDA has increased its financial efficiency, and scaled
up its financing to support the escalating demand for its resources to deliver on the following priorities:
• Provide concessional financing on terms that respond to clients’ needs; and
• Ensure long-term financial sustainability of IDA’s financial model through a prudent risk management framework.
Non-concessional lending will primarily be financed by market debt. Concessional lending, including grants, is
primarily financed by IDA’s equity. As IDA’s funding program expands under the hybrid financing model, a bigger
portion of concessional lending will be funded by market debt, together with member countries’ contributions (equity).
Funds not deployed for lending are maintained in IDA’s investment portfolio to supply liquidity for its operations.
See Figure 1.
4
IDA’s members are owners and hold voting rights in IDA. Members do not, however, hold shares in IDA and are therefore not
referred to as shareholders. Payments for subscriptions and contributions from members increase IDA’s paid-in equity and are
financially equivalent to paid-in capital in multilateral development organizations that issue shares.

Section II: Overview
June 30, 2022 7
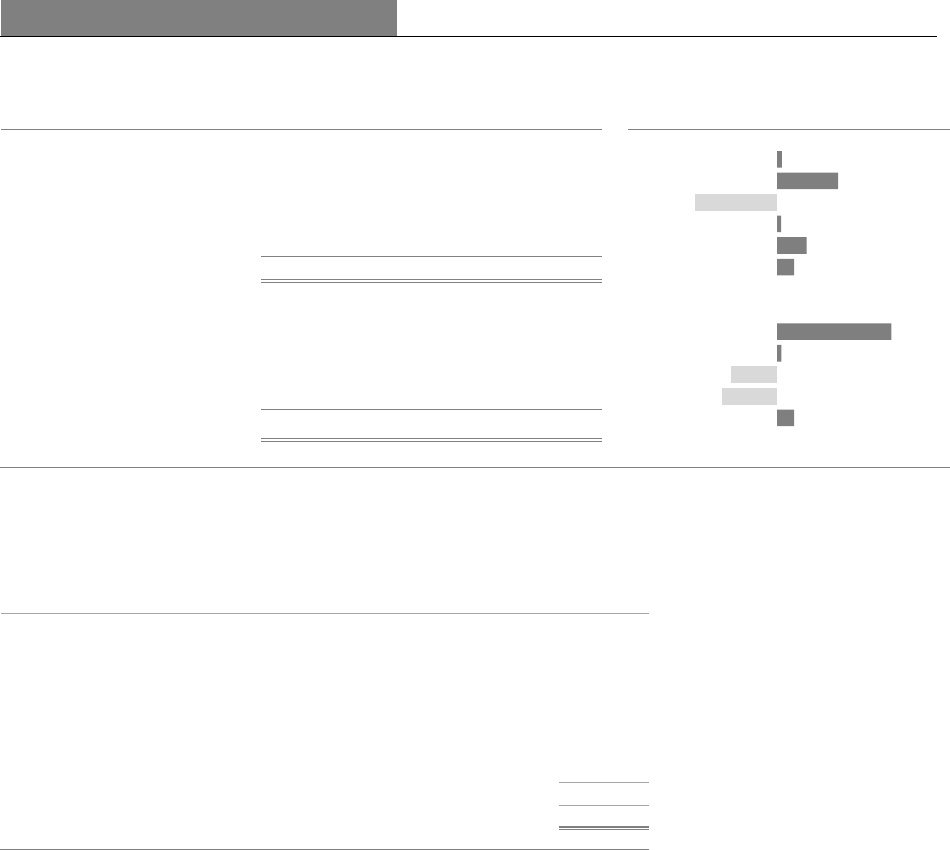
Figure 1: IDA's Financial Business Model
Basis of Reporting
IDA prepares its financial statements in conformity with accounting principles generally accepted in the United States
of America (U.S. GAAP). IDA’s functional currencies are the SDR and its component currencies of the U.S. dollar,
euro, Japanese yen, pound sterling and Chinese renminbi and IDA’s reporting currency is the U.S. dollar. Management
uses net income as the basis for deriving adjusted net income, as discussed in Section IV: Financial Results.
Adjusted Net Income
Adjusted Net Income (ANI), a non-GAAP measure, reflects the economic results of IDA’s operations and is used by
IDA’s management and the Board as a financial sustainability measure. ANI is defined as IDA’s net income, adjusted
to exclude certain items. After the effects of these adjustments, the resulting ANI generally reflects amounts which
are realized, not restricted for specific uses, and not directly funded by members. For a detailed discussion of the
adjustments, see Section IV: Financial Results.
Non Concessional Lending
Concessional Lending and Investments
Grants
Reflows and Operating
Results
Borrowings
Equity

8 June 30, 2022
Financial Resources
IDA’s replenishments have grown from $1.0 billion in the initial replenishment to $93 billion in IDA20. Members’
subscriptions and contributions receivable for each replenishment are settled through payment of cash or deposit of
nonnegotiable, non-interest-bearing demand notes which become due throughout the replenishment period, generally
three years. The notes are encashed by IDA on a pro rata basis over a 9 to 11-year period which generally corresponds
with the disbursement period of the loans and grants.
IDA19 Funding
In April 2021, the IDA19 financing period was shortened to two years (FY21-FY22) and the IDA19 financing
framework was adjusted to $71 billion from the original commitment authority of $82 billion. The remaining $11
billion was carried forward to be utilized in the replenishment period of IDA20. In April 2022, IDA’s Board approved
an increase in the adjusted IDA19 commitment authority by $1 billion to $72 billion to support the urgent development
financing needs and to supplement IBRD and development partners’ support for Ukraine. The increase did not impact
the use of the original IDA19 financing plan of $71 billion.
As of June 30, 2022, IDA completed its nineteenth replenishment period. See Table 1 for results for IDA19 sources
and uses.
Table 1: Results for IDA19 Sources and Uses
In billions of U. S. dollars
Sources
USD equivalent
a
Member equity contributions
$
23.5
Member compensation for MDRI
3.9
Reflows, carryover, and borrowings
54.7
Transfers from IBRD
0.9
Total Sources
$
83.0
Uses
USD equivalent
b
Concessional financing
Loans and guarantees
c
$
45.1
Grants
25.4
Non-concessional financing
4.5
Private Sector Window
1.7
Less: Recommitments of cancellations from previous replenishments
(4.7)
Total Uses
$
72.0
Carry-over to IDA20
$
11.0
Total Uses and Carry-over
$
83.0
a. U.S. dollar amounts are based on IDA19 reference rate of USD/SDR 1.38318. The U.S. dollar amounts are provided for reporting
purposes only.
b. U.S. dollar amounts are based on exchange rate as per the date of approval.
c. Includes $1.2 billion of loans approved by the Board in July 2022 due to the extension of the closing date for the approval of
IDA19 operations.
Figure 2 below shows the allocation of IDA19 sources to fund IDA’s lending activities (excluding PSW activities).
Figure 2: Funding Allocation during IDA19 replenishment period
Regular loans
23%
Blend loans
37%
Grants
34%
Non-concessional
6%

June 30, 2022 9
Table 2: Cumulative Net Commitments during the IDA19 replenishment period
In millions of U.S. dollars
As of June 30, 2022
Loans and
Guarantees
Grants
Total
Concessional financing
IDA Country Allocations
$
39,382
$
19,576
$
58,958
IDA Concessional Windows
Regional Window
3,447
2,450
5,897
Window for Host Communities and Refugees
30
1,239
1,269
Crisis Response Window
1,024
1,089
2,113
Arrears Clearance
-
1,000
1,000
Non-concessional financing
4,518
-
4,518
Total Net Commitments
a
$
48,401
$
25,354
$
73,755
a. Commitments are net of full cancellations/terminations approved in the same fiscal year. Commitments exclude IDA-IFC-MIGA
Private Sector Window (PSW) activities of $1.7 billion, and $1.2 billion of loans approved by the Board in July 2022 associated with
IDA19.
IDA20 Funding
IDA’s financing resource envelope available for lending and grant commitments is based on the long-term outlook of
IDA’s financial sustainability. This takes into account the amount of member contributions and the concessionality of
the proposed financing to borrowers, market conditions, and capital adequacy requirements.
Allocation of IDA20 Resources
Eligibility for IDA’s resources is determined primarily by a member’s relative poverty. Relative poverty is defined as
Gross National Income (GNI) per capita below an established threshold and is updated annually. For FY23, the
threshold is $1,255 (FY22: $1,205).
Table 3: IDA20 Sources and allocation
In billions of U.S dollars
Sources
USD equivalent
a
Member equity contributions
$
23.5
Member compensation for MDRI
1.8
Reflows, carryover, and borrowings
66.9
Transfers from IBRD
0.8
Total Sources
$
93.0
Allocation
USD equivalent
a
Concessional financing
Country Allocation Envelope
$
62.8
IDA Concessional Windows
21.4
Non-concessional financing
6.3
Private Sector Window
2.5
Total Allocation
$
93.0
a. U.S. dollar amounts are based on IDA20 reference rate of USD/SDR 1.42934. The U.S. dollar amounts are provided for reporting
purposes only.

10 June 30, 2022
As of July 1, 2022, 74 countries are eligible to borrow from IDA on concessional terms as follows:
IDA eligible
countries
IDA-only
40 countries that (a) have not exceeded the IDA operational cut-off GNI per capita for
more than two consecutive years; and (b) are not creditworthy to borrow from IBRD.
This includes: 11 Small Island Economies that have per capita incomes above the IDA
operational cut-off for more than two consecutive years, but that have been granted
-.
2 countries with loans in nonaccrual status, which were -o
time they became nonaccrual countries.
Gap
17 countries that are (a) determined by IDA to be eligible for IDA financing; (b)
determined by IDA to have a GNI per capita that has exceeded the cut-off for IDA
eligibility for more than two consecutive years; and (c) not currently determined by
IBRD to be creditworthy to borrow from IBRD. This includes 3 Small States that are
not island states.
Blend
14 countries that are determined: (a) by IDA to be eligible for IDA financing; and (b)
by IBRD to be creditworthy to borrow from IBRD. This includes 6 Small Island
Economies and 1 Small State that is not an island state.
1
it became a nonaccrual country.
IDA financing is provided in the form of loans, grants, and guarantees. Most of IDA’s resources are allocated to
eligible members through IDA Country Allocations that provide unearmarked support. IDA Country Allocations are
determined using the Performance Based Allocation (PBA) system, which takes into account the country’s
performance rating (CPR), population size and per capita income, and complemented by the FCV envelope. The rest
of IDA resources are provided through five IDA Windows dedicated to addressing specific development priorities,
and an Arrears Clearance framework that provides exceptional support for countries to fully reengage with the World
Bank. The allocation framework is agreed for each replenishment cycle.
Figure 3: Allocation of IDA20 Resources
Allocation - Performance Based Allocation (PBA) System
IDA’s resources are allocated to eligible members, using its PBA system and the allocation framework agreed during
each replenishment. These allocations depend on several factors: the overall availability of IDA’s resources, individual
country needs, their policy performance and institutional capacity, and each country’s performance relative to others.
The PBA system is designed to provide resources where they are likely to be most helpful in reducing poverty.
Under the PBA, the main factor that determines the allocation of IDA’s core concessional resources among eligible
countries is their performance in the Country Policy and Institutional Assessment (CPIA). The CPIA reflects the
results of an exercise that rates eligible countries against a set of criteria including economic management; structural
policies; policies for social inclusion and equity; and public-sector management and institutions. The CPIA and
portfolio performance together constitute the IDA Country Performance Rating (CPR). In addition to the CPR,
population, and per capita income are factored into a country’s allocation, along with the annual base allocation
(SDR15 million per country). In addition, country allocations provide the FCV envelope to enhance support for
eligible countries facing different FCV risks. The Sustainable Development Finance Policy (SDFP), which became
effective at the beginning of IDA19, aims to incentivize IDA-eligible countries to move towards transparent,
sustainable financing and to promote coordination between IDA and other creditors in support of these countries’
June 30, 2022 11
efforts to address their debt-related vulnerabilities. A set-aside from or a discount of IDA’s country allocation are used
to incentivize satisfactory implementation of Performance and Policy Actions. Countries which demonstrate
satisfactory progress in implementing their Performance and Policy Actions have access to their full annual country
allocation. Countries that do not satisfactorily implement their Performance and Policy Actions will either have a
share of their country allocation set aside or their country allocation will be reduced.
In recognition of the change in IDA’s business model starting in IDA18, and to ensure that its lending decisions are
compatible with the capital adequacy requirements of a triple-A rating, the allocation framework for IDA20 continues
to be aligned with the Single Borrower Limit (SBL) and capital adequacy requirements under the DSC Framework,
see Section IX: Risk Management.
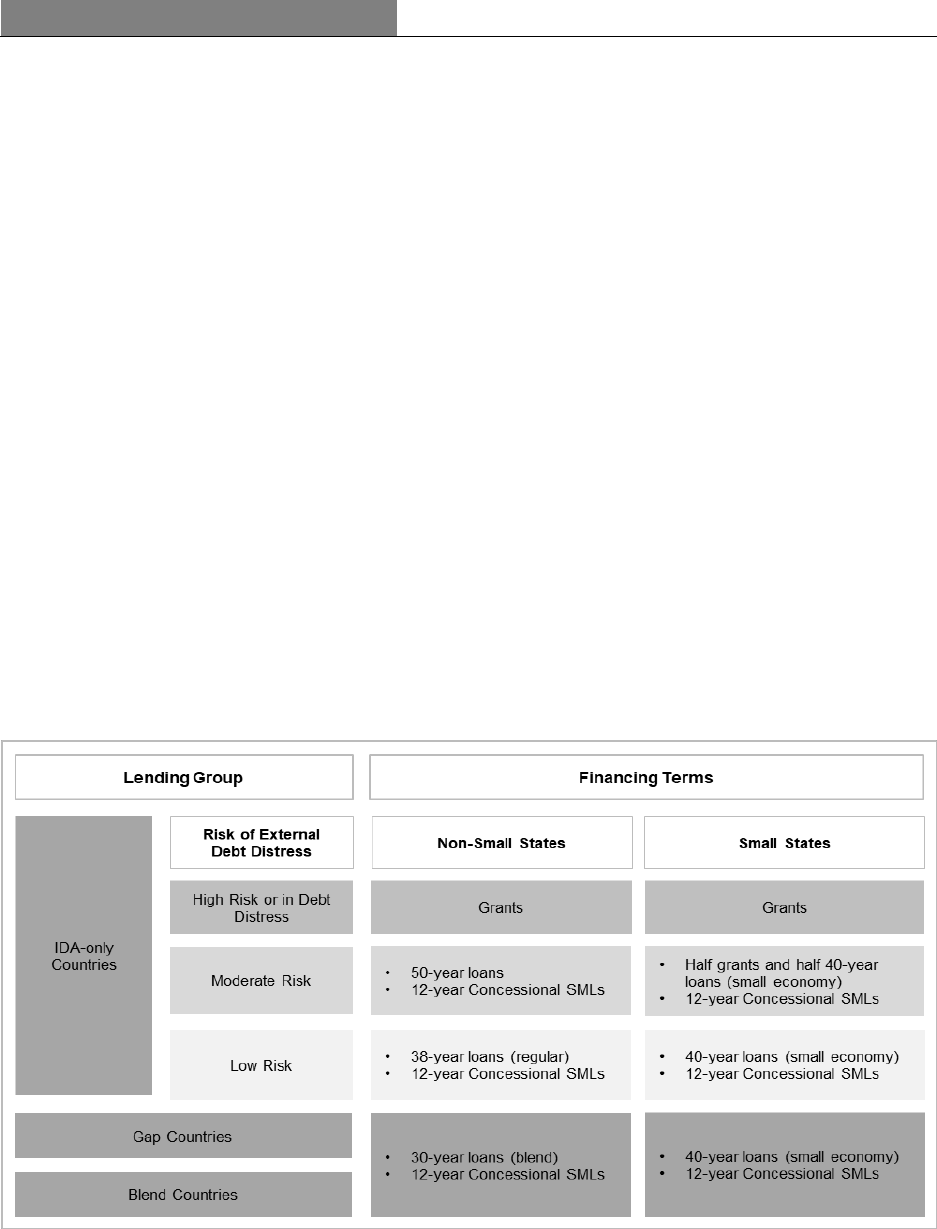
Concessional Financing
Concessional financing is provided in the form of loans, grants and guarantees. Eligibility and percentage of allocation
for grants for IDA-only countries are based on an assessment of the country’s risk of debt distress, where countries
with high risk of debt distress will receive their IDA assistance in grants. Gap and Blend countries are only eligible
for grant financing via the Window for Host Communities and Refugees, if applicable.
As part of IDA’s balance sheet optimization measures, new financing terms have been introduced in IDA20 which
include:
• Concessional Shorter-Maturity Loans (SMLs). Concessional SMLs will be offered through the Scale-Up Window
(SUW) and country allocations based on the PBA system. IDA-only countries at moderate and low risk of debt
distress, including Small States, as well as IDA Gap and Blend countries (unless they are high risk Small States),
will receive a portion of their country allocations as SMLs.
• 50-year loans for IDA-only countries at moderate risk of debt distress in lieu of the previous financing terms of
half grants and half loans, with an exception for Small States. IDA-only Small States at moderate risk of debt
distress will continue to receive half grants and half loans.
See Figure 4 for Overview of IDA20 Financing Terms.
Figure 4: Overview of IDA 20 Financing Terms

12 June 30, 2022
Country Allocation Envelope represents $62.8 billion of the IDA20 resource envelope and is allocated based on the
PBA. The amount available for each country is a function of the country’s CPR rating, population, and per capita
income, complemented by the FCV envelope, where applicable. With the introduction of new financing terms in
IDA20, some IDA countries will receive a portion of their country allocations as concessional SMLs. In addition,
IDA-only countries at moderate risk of debt distress, with the exception of Small States, will receive their country
allocations as 50-year loans. Previously, these countries were eligible for half grants and half loans.
IDA Concessional Windows allow IDA to respond to specific needs of its members. In IDA20, $21.4 billion of the
IDA20 resource envelope will be used to fund the following:
• $7.9 billion of Regional Window.
• $2.4 billion of Window for Host Communities and Refugees.
• $3.3 billion of Crisis Response Window.
• $7.8 billion of Concessional Scale-up Window (SUW) – SMLs.
Regional Window
The Regional Window was developed as a funding mechanism to provide additional resources to finance projects that
help low‐income countries achieve their regional integration objectives. IDA fosters regional integration by playing
three overlapping roles:
• supporting an enabling environment through advisory and analytical work;
• financing projects through policy and investment loans; and
• convening state and nonstate actors for coordination and collective actions.
Window for Host Communities and Refugees (WHR)
The Window for Host Communities and Refugees will support operations that promote medium-to long-term
development opportunities for refugee and host communities in IDA countries. The purpose of the WHR is to support
refugee hosting countries to:
• create social and economic development opportunities for refugee and host communities;
• facilitate solutions that include sustainable socio-economic inclusion of refugees in the host country and/or their
return to the country of origin; and
• strengthen country preparedness for increased or potential new refugee flow.
Crisis Response Window (CRW)
The primary objective of the CRW is to provide IDA countries with additional resources that will help them to respond
to major natural disasters, or public health emergencies and severe economic crises, so that they can return to their
long-term development paths. The $3.3 billion window under the IDA20 resource envelope includes an allocation of
up to $1.0 billion under the CRW Early Response Financing (ERF) which will support IDA countries’ response to
slower-onset crises, namely disease outbreaks and food insecurity.
Concessional Scale-up Window – Shorter Maturity Loans (SUW-SML)
The Shorter Maturity Loans under the Scale-up Window will provide additional concessional resources with an
allocation of $7.8 billion in eligible countries i.e., IDA-only countries at low or moderate risk of debt distress, as well
as Gap and Blend countries (except Small States that are at high risk or in debt distress).
Non-Concessional Financing
Non-Concessional financing comprises loans and guarantees whose terms are aligned with those of IBRD’s flexible
loans and guarantees. Under the adjusted IDA20 resource envelope, $6.3 billion of resources have been allocated to
non-concessional financing which entirely relates to the regular Scale-up Window.
Non-Concessional Scale-up Window: The Non-Concessional Scale-up Window is a window of resources
established to enhance support for high-quality, transformational, country-specific and/or regional operations with
strong development impact. Allocation of Non-Concessional Scale-up Window resources to the regions will broadly
conform to the allocations under the PBA, excluding countries at a high risk of debt distress. Allocations are balanced
between IDA-only and Blend countries, and to avoid countries from having a concentration of Non-Concessional
Scale-up Window resources. Implementation arrangements will prioritize a country’s ability to absorb resources and

Resources
June 30, 2022 13
the proposed projects’ alignment with IDA20 policy priorities and the debt-related Sustainable Development Finance
Policy.
Private Sector Window (PSW)
The IDA-IFC-MIGA Private Sector Window was created under IDA18 to mobilize private sector investment in IDA-
only countries and IDA-eligible Fragile and Conflict-affected Situations. In IDA19, the PSW was allocated an initial
envelope of $2.5 billion which was revised to $1.7 billion under the adjusted IDA19 resource envelope. Under IDA20,
$2.5 billion has been allocated to the PSW envelope.
PSW is deployed through four facilities. These facilities have been designed to target critical challenges faced by the
private sector and will leverage IFC and MIGA’s business platforms and instruments.
During FY22, $1,107 million of the IDA19 PSW resources, net of full terminations and cancellations, were committed.
As of June 30, 2022, $879 million had been utilized out of a combined total of $2.9 billion committed in IDA18 and
IDA19. See Notes to the Financial Statements for the year ended June 30, 2022, Note G –Transactions with Affiliated
Organizations – Table G4.
Table 4: Utilization of PSW Commitments
In millions of U.S. dollars
As of June 30, 2022
IDA18
IDA19
Total
Utilization Measure
Allocation
a
$
1,282
$
1,668
$
2,950
Net Commitments
b
1,282
1,665
2,947
of which utilized
Guarantees
$
638
Face value of outstanding guarantees
Derivatives
132
Notional amount
Funding of IFC's PSW-related equity
investments
59
Amortized cost
Loans
50
Amortized cost
Total utilization of IDA PSW
$
879
a. IDA18 final allocation of $1,370 million was reduced by $88 million of cancellations which were reallocated to IDA19 PSW.
b. Of the $1,282 million net commitments under IDA18 PSW, $79 million was returned to country allocations and is no longer available
for utilization.
Arrears Clearance Framework
IDA has a policy of not providing additional financing to borrowers who are overdue on their current payments to
IDA or IBRD. However, it may engage with these countries under limited and clearly defined circumstances. IDA’s
arrears clearance framework sets out these circumstances, including (i) pre-arrears clearance grants; and (ii) the arrears
clearance set-aside, that can only be financed under the arrears clearance operations. In IDA20, no allocation was set
aside towards arrears clearance to support the possible reengagement of IDA countries that are currently in arrears.
However, during the IDA20 period, should meaningful progress arise in any country in arrears, a reallocation
discussion with IDA members will be initiated.
(i) Pre-Arrears Clearance Grants (PACG)
The PACG mechanism enables IDA to engage early in support of a government undertaking convincing reforms. This
was first introduced in IDA12 to be used to finance high priority activities related to the preparation of a program of
social and economic recovery and to build resilience until the arrears are fully cleared. Conditions constituting this
framework include indications that:
• early performance is promising as evidenced by the recipient country having taken convincing steps towards social
and economic recovery.
• arrears to IDA and/or IBRD are large and protracted and cannot be easily or quickly cleared using domestic
resources.
• a concerted international effort to provide positive financial flows and other assistance is underway, and other
creditors have agreed not to make net withdrawals of financial resources from the country.
• alternative sources of financing for post-conflict recovery are inadequate or available only on inappropriate terms;
and

14 June 30, 2022
• Pari passu sharing arrangements are in place between preferred creditors, for any payments made by the country
in advance of arrears clearance.
The PACG program has met its objectives with each of the prior PACG recipients successfully clearing all their arrears
to IDA. Prior PACG recipients are Democratic Republic of the Congo, Cote d’Ivoire, Afghanistan, Liberia, Myanmar,
Somalia, and Sudan for an amount totaling $802 million between FY01 and FY22.
(ii) Arrears Clearance Set-Aside
The arrears clearance set-aside (ACSA) forms part of IDA’s overall financing commitments. It is financed by
additional member contributions under the replenishments. In IDA15, the arrears clearance was further enhanced.
IDA members agreed to ring-fence arrears clearance support to IDA countries that were in arrears as of December 31,
2006 and meet a very narrow and well-defined set of criteria– see below, including eligibility for support under the
Heavily Indebted Poor Countries (HIPC) debt initiative. Amounts were set aside within the IDA replenishment so that
when circumstances allow, IDA would be able to help countries clear arrears and fully re-engage with the World
Bank.
To be considered for any arrears clearance support, the country would need to meet the following criteria:
• be eligible for HIPC debt relief;
• agree to implement a medium-term growth-oriented reform program endorsed by the World Bank;
• ensure a sustainable macro and sustainable debt service after arrears clearance;
• agree on a stabilization program endorsed by the International Monetary Fund (IMF) management and monitored
by IMF staff or supported by an IMF arrangement; and
• agree to a financing plan for full clearance of arrears, including normalization with other Multilateral
Development Banks (MDBs).
In addition, to receive support for arrears clearance, project proposals should meet re-engagement criteria based on
facts and circumstances of each case.

Section IV: Financial Results
June 30, 2022 15
Section IV: Financial Results
Financial Results and Portfolio Performance
Net Income
IDA had net income of $12 million in FY22 compared with a net loss of $433 million in FY21 (See Table 5). The
increase in net income during the year was primarily driven by:
• A positive change of $0.9 billion in non-functional currency translation adjustment gains/(losses) primarily
attributable to the depreciation of the majority of the non-functional currencies against the U.S. dollar in FY22
compared to the appreciation of these currencies in FY21;
• A decrease of $0.5 billion in development grant expenses primarily due to the disbursement of $1.3 billion of
development grants to Sudan in FY21 in support of the re-engagement and reform program after its arrears
clearance;
• An increase of $0.4 billion in unrealized mark-to-market gains on non-trading portfolios. The increase was mainly
driven by higher mark-to-market gains from the derivatives held for the Capital Value Protection Program (CVP),
as the increase in U.S. dollar and Euro interest rates for long tenors during the year was higher compared to FY21;
partially offset by
• A charge of $0.3 billion for provision for losses on loans and other exposures in FY22 compared to a release of
$0.5 billion in FY21 driven by a $0.8 billion release of provision after Sudan cleared its overdues in FY21.
Adjusted Net Income
Adjusted Net Income, a non-GAAP measure, reflects the economic results of IDA’s operations and is used by IDA’s
management and the Board as a financial sustainability measure. ANI is defined as IDA’s net income, adjusted to
exclude the following items.
• Development financing activities directly funded by contributions from members: These are mainly comprised of
development grants, provision for HIPC / Multilateral Debt Relief Initiative (MDRI) debt relief, amortization of
discounts on CPL. For financial reporting, these activities are treated as expenses, while contributions from
members which finance these activities, are reflected directly in IDA’s equity since they carry voting rights.
• Contributions/grants received from affiliated organizations or other similar contributions: These are mainly
comprised of contributions from IBRD, IFC and other contributions from trust funds. These are intended to finance
development activities similar to member contributions but are not directly included in equity as they do not carry
voting rights.
• Non-functional currency translation adjustment (gains) losses: These represent unrealized exchange rate
gains/losses resulting from the translation of loans, borrowings, development grants payable and all other assets
and liabilities still held on IDA’s Balance Sheet, that are denominated in currencies other than the component
currencies of SDR.
• Unrealized mark-to-market gains/losses on non-trading portfolios: These are mainly comprised of unrealized
mark-to-market gains and losses on the asset/liability management (ALM), borrowing, and non-trading investment
portfolios. For the purpose of ANI, the result of loan revenue hedges is not part of the adjustment related to
unrealized mark-to-market gains/losses on non-trading portfolio since the objective of the loan revenue hedges is
to stabilize IDA’s revenue against any currency risk.
• Unrealized mark-to-market gains/losses on certain positions in the investment trading portfolios, net: This
adjustment applies to trades where the unrealized gains and losses on derivative forward contracts are recorded in
the income statement and the underlying physical assets being purchased and sold are recorded at amortized cost
during the holding period. In these cases, the unrealized gains, and losses on the forward contract at the end of the
reporting period (if any) are excluded from net income when calculating adjusted net income. As of June 30, 2022,
there were no active trades requiring adjustment.
• Pension, Post-Employment Benefit Plan (PEBP) and Post-Retirement Contribution Reserve (PCRF) adjustments:
While IDA is not a participating sponsor to these benefit plans, IDA shares in the costs and reimburses IBRD for
its proportionate share of any contributions made to these plans by IBRD, as part of a Board-approved cost sharing
ratio. The Pension adjustment reflects the difference between IDA’s share of cash contributions to both the pension
plans and PCRF, and the accounting expense, as well as the investment revenue earned on those assets related to
Section IV: Financial Results
16 June 30, 2022
the PEBP and PCRF. The PCRF was established by the Board to stabilize contributions to the pension and post-
retirement benefits plans. Management has designated the income from these assets to meet the needs of the
pension plans. As a result, PEBP and PCRF investment revenue is excluded from adjusted net income.
• Other Adjustments:
i. Under certain arrangements (such as Externally Funded Outputs (EFOs)), IDA receives a share of the revenue
earned from agreements with donors under which funds received are to be used to finance specified outputs
or services. These funds may be utilized only for the purposes specified in the agreements and are therefore
considered contractually restricted until applied for these purposes. Income attributable to these arrangements
is excluded from reported income when determining adjusted net income since there is no discretion about the
use of these funds.
ii. Effective from FY22, the difference between fee revenue and expenses from the Reserve Advisory and
Management Partnership (RAMP) program is excluded from the reported net income to arrive at adjusted net
income. Under the Board-approved framework, RAMP fees are dedicated for the purpose of providing
technical assistance and asset management services to external clients. Due to the potential timing mismatch
between fee revenue (recognized as earned) and program expenditures (recognized as incurred), fees earned
in a given fiscal year may be used to provide services in a future fiscal year. To ensure that RAMP revenues
are only used for the delivery of RAMP services, and not allocated for other purposes, any difference between
fee revenue and expenses from RAMP included in reported net income will be excluded to arrive at adjusted
net income.
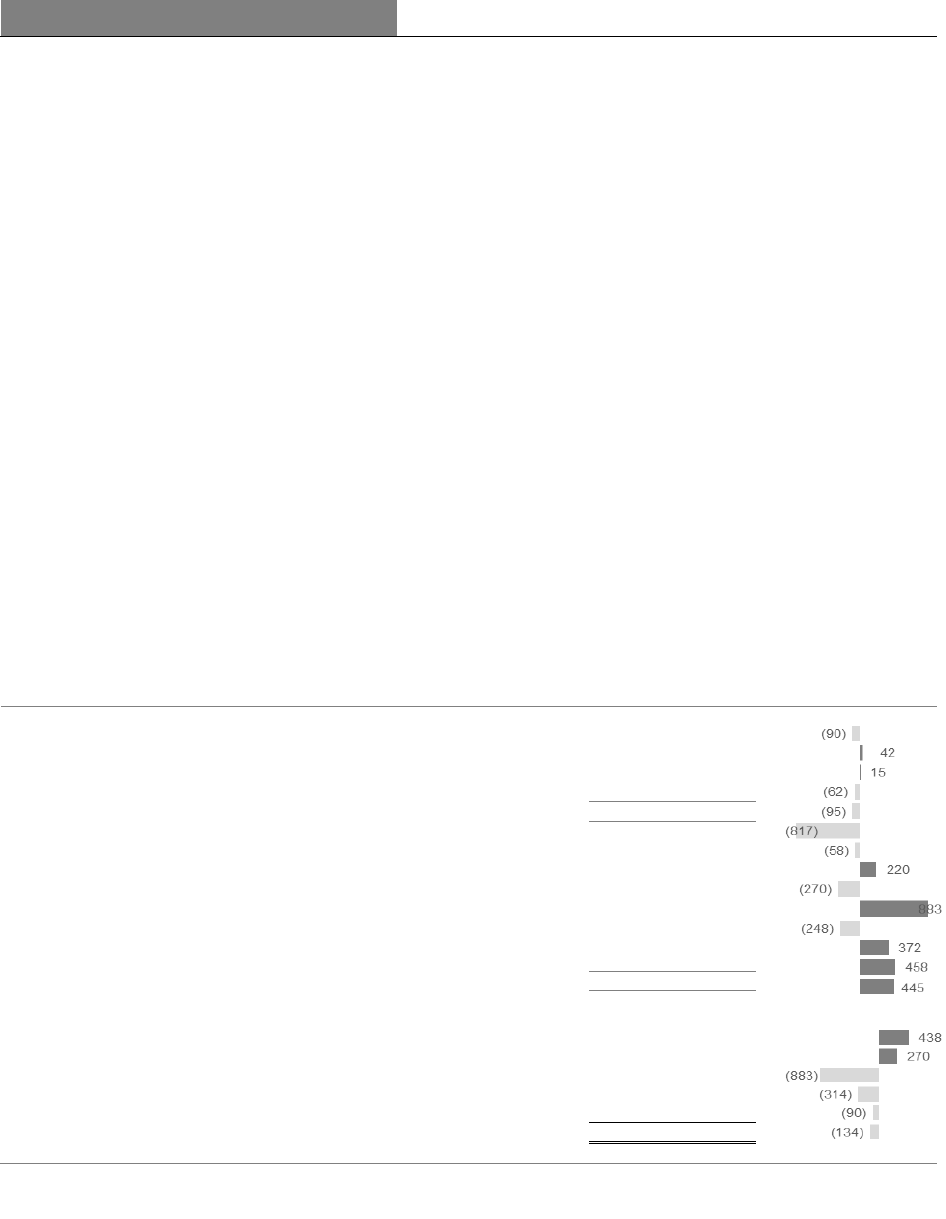
IDA’s adjusted net income was $260 million in FY22 compared with $394 million in FY21 (See Table 5). The
decrease of $134 million was primarily driven by a $90 million decrease in net interest revenue on loans mainly due
to the recognition of $244 million of service charge revenue in FY21 when Sudan paid all the overdue principal and
service charges due to IDA.
Table 5: Condensed Statement of Income
In millions of U.S. dollars
For the fiscal year ended June 30,
2022
2021
Negative
Impact
Positive
Impact
Interest revenue
Loans, net
$
1,960
$
2,050
Investments, net
189
147
Asset-liability management derivatives, net
1
(14)
Borrowing expenses, net
(249)
(187)
Interest revenue, net of borrowing expenses
$
1,901
$
1,996
Provision for losses on loans and other exposures, (charge) release
(278)
539
Other (expenses) revenue, net (Table 14)
(2)
56
Net non-interest expenses (Table 12)
(1,392)
(1,612)
Transfers from affiliated organizations and others
274
544
Non-functional currency translation adjustment gains (losses), net
511
(372)
Unrealized mark-to-market (losses) gains on investments-trading portfolio, net
a
(104)
144
Unrealized mark-to-market gains on non-trading portfolios, net
1,474
1,102
Development grants
(2,372)
(2,830)
Net Income (Loss)
$
12
$
(433)
Adjustments to reconcile net (loss) income to adjusted net income:
Expenses relating to development financing activities directly funded by
contributions from members
2,508
2,070
Contributions from affiliated organizations and others
(274)
(544)
Non-functional currency translation adjustment (gains) losses, net
(511)
372
Unrealized market-to-market gains on non-trading portfolios, net
b
(1,432)
(1,118)
Pension and other adjustments
(43)
47
Adjusted Net Income
$
260
$
394
a. Includes IDA’s share of returns from Post-Employment Benefit Plan (PEBP) and Post-Retirement Contribution Reserve
Fund (PCRF) assets – $37 million negative return (FY21- $184 million positive return).
b. Excludes $42 million of gains from revenue-related forward currency contracts (FY21 - $16 million of losses).
Section IV: Financial Results
June 30, 2022 17
Table 6: Condensed Balance Sheet
In millions of U.S. dollars
As of
June 30, 2022
June 30, 2021
Decrease
Increase
Assets
Due from banks
$
686
$
496
Investments
39,827
37,376
Net loans outstanding
a
174,490
177,779
Derivative assets, net
404
249
Other assets
4,607
3,424
Total assets
$
220,014
$
219,324
Liabilities
Borrowings
$
32,899
$
28,314
Derivative liabilities, net
579
408
Other liabilities
7,868
9,726
Equity
178,668
180,876
Total liabilities and equity
$
220,014
$
219,324
a. The fair value of IDA’s loans was $141,193 million as of June 30, 2022 ($164,606 million –June 30, 2021).
Equity
See Table 7 below for the change in IDA’s equity during FY22:
Table 7: Changes in Equity
In millions of U.S. dollars
Equity as of June 30, 2021
$
180,876
Change during the year:
Subscriptions and contributions paid-in
7,325
Nonnegotiable, noninterest-bearing demand obligations
1,265
Change in Accumulated deficit
12
Change in Accumulated other comprehensive (loss) income
(10,808)
Change in Deferred amounts to maintain value of currency holdings
(2)
Total change
(2,208)
Equity as of June 30, 2022
$
178,668
Results from Lending Activities
Loan Portfolio and Grant Activity
As of June 30, 2022, IDA’s net loans outstanding was $174.5 billion, lower by $3.3 billion compared with June 30,
2021. The decrease was mainly due to currency translation losses of $12.5 billion, consistent with the depreciation of
the SDR by 6.9% against the U.S. dollar during the year, partially offset by net disbursements of $9.1 billion during
the year.
As of June 30, 2022, 88% of IDA’s total loans outstanding were denominated in the SDR. For the regional presentation
of total loans outstanding, see Notes to the Financial Statements for the year ended June 30, 2022, Note D – Loans
and Other Exposures – Table D8.
Provision for losses on loans and other exposures
In FY22, IDA recorded a provision for losses on loans and other exposures of $278 million primarily due to the
increase in exposure during the year. This compares to a $539 million release of provision in FY21 mainly due to an
$831 million release of loan loss provision after Sudan cleared its arrears in March 2021 (see Notes to the Financial
Statements for the year ended June 30, 2022, Note D – Loans and Other Exposures – Table D5).
For adjusted net income purposes, the provision for losses on loans and other exposures excludes the provision for
debt relief under HIPC/MDRI and the provision for grant advances since these are funded by contributions from
members.
690
(2,208)
(1,858)
171
4,585
690
1,183
155
(3,289)
2,451
190

Section IV: Financial Results
18 June 30, 2022
Table 8: Provision for losses on loans and other exposures
In millions of U.S. dollars
For the fiscal year ended June 30,
2022
2021
Variance
Provision for losses on loans and other exposures, (charge) release
Loans and other exposures
$
(283)
$
(289)
$
6
Debt relief under HIPC/MDRI
5
828
(823)
Total
$
(278)
$
539
$
(817)
Table 9: Net Loans Outstanding Activity
In millions of U.S. dollars
Net Loans outstanding as of June 30, 2021
$
177,779
Change during the year:
Gross loan disbursements
15,860
Loan repayments
(6,738)
Change in accumulated provision for loan losses
a
135
Translation adjustments
(12,505)
Other
b
(41)
Total change
(3,289)
Net Loans outstanding as of June 30, 2022
$
174,490
a. Includes translation adjustments on accumulated provision for loan
losses and debt relief under HIPC/MDRI. See Notes to the Financial
Statements, Note D – Loans and other exposures.
b. Includes deferred loan origination costs of $11 million, and HIPC debt
relief provided of $30 million.
Figure 5: Net Loans Outstanding
In billions of U.S. dollars
IDA’s loans generally disburse within five to ten years for Investment Project Financing (IPF), and one to three years
for Development Policy Financing (DPF). Therefore, each year’s disbursements also include amounts relating to
commitments made in earlier years (See Table 10).
Table 10: Gross Disbursements of Loans and Grants by Region
In millions of U.S. dollars
2022
2021
For the fiscal year ended June 30,
Loans
a
Grants
b
Total
Loans
a
Grants
b
Total
Variance
Eastern and Southern Africa
$
4,520
$
2,613
$
7,133
$
4,785
$
3,296
$
8,081
$
(948)
Western and Central Africa
4,942
1,602
6,544
4,384
1,661
6,045
499
East Asia and Pacific
1,365
137
1,502
1,186
111
1,297
205
Europe and Central Asia
631
133
764
736
144
880
(116)
Latin America and the Caribbean
346
164
510
369
126
495
15
Middle East and North Africa
63
496
559
70
309
379
180
South Asia
3,952
250
4,202
5,145
599
5,744
(1,542)
Total
$
15,819
$
5,395
$
21,214
$
16,675
$
6,246
$
22,921
$
(1,707)
a. Excludes PSW related disbursements - $41 million (FY21 - $6 million).
b. Excludes Project Preparation Advances (PPA).
As of June 30, 2022, 59% of IDA’s loans were on regular terms (75 basis points SDR equivalent service charge) see
Table 11. The decrease in IDA’s revenue from loans in FY22 compared to FY21 was primarily due to $244 million
of service charges recorded in March 2021 when Sudan paid all its overdue principal and charges due to IDA.
161
178
174
0
50
100
150
200
Jun 20 Jun 21 Jun 22

Section IV: Financial Results
June 30, 2022 19
Table 11: Revenue and Balances by Product Category
In millions of U.S. dollars
Interest revenue on loans
a
Balance as of June 30,
For the fiscal year ended June 30,
Category
2022
2021
2022
2021
Loans
Concessional
Regular
$
104,716
$
109,612
$
829
$
1,055
Blend
65,617
65,203
970
862
Hard
b
1,327
1,406
47
49
Non-concessional
c
6,381
5,273
116
85
Others
d
50
10
1
1
Total
$
178,091
$
181,504
$
1,963
$
2,052
a. Excludes interest rate swap expenses related to loan hedges - $3 million ($2 million in FY21).
b. Prior to July 1, 2017, IDA offered Hard-Term loans to Blend Countries (excluding Small Island Economies). Hard-term loans are no
longer offered.
c. In addition, $24 million of commitment charges were earned in FY22 on undisbursed balances of non-concessional loans ($19
million in FY21).
d. Represents loans under the PSW.
Results from Investing Activities
Investment Portfolio
IDA’s net investment portfolio increased to $39.6 billion as of June 30, 2022, from $37.9 billion as of June 30, 2021.
The increase was primarily due to the investment of cash received from member contributions and proceeds from net
new debt issuances, partially offset by net loan and grant disbursements.
Investment interest revenue, net of derivatives
During FY22, IDA’s net interest revenue from investments was $189 million, an increase of $42 million compared
with FY21. The increase in interest revenue was mainly driven by the higher average interest rate environment in the
current year and the higher average balance of the portfolio.
Figure 6: Net Investment Portfolio
In billions of U.S. dollars
Figure 7: Net Investment Revenue
In millions of U.S. dollars
Results from Borrowing Activities (excluding associated derivatives)
As of June 30,2022, Market borrowings recorded at fair value were $19.7 billion, a decrease of $0.9 billion compared
to June 30, 2021 ($20.6 billion). The decrease was driven mainly by the impact of increasing interest rates and
translation gains during the year. See Notes to the Financial Statements for the year ended June 30, 2022, Note E –
Borrowings.
As of June 30, 2022, the market borrowings at amortized cost were $6.2 billion (Nil – June 30, 2021). In FY22, IDA
started to issue long-term fixed rate market debt to fund fixed rate loans and the new issuances during the year were
$6.2 billion. See Notes to the Financial Statements for the year ended June 30, 2022, Note E – Borrowings.
Concessional partner loans from members, recorded at amortized cost were $7.0 billion ($7.7 billion - June 30, 2021).
The decrease of $0.7 billion was mainly due to translation adjustment gains.
35.6
37.9 39.6
0
10
20
30
40
Jun 20 Jun 21 Jun 22
0
100
200
300
400
500
FY18 FY19 FY20 FY21 FY22
Section IV: Financial Results
20 June 30, 2022
Figure 8: Borrowings
In billions of U. S. dollars
Transfers from Affiliated Organizations
Since 1964, IBRD has made transfers to IDA out of its net income, upon approval by the Board of Governors. Under
a formula-based approach for IBRD's income support to IDA, the amount of income transfer recommended for IDA
is a function of IBRD's financial results. On October 14, 2021, IBRD’s Board of Governors approved a transfer from
FY21 allocable income of $274 million to IDA which was received by IDA on October 25, 2021.
Net Non-Interest Expense
As shown in Table 12, IDA’s net non-interest expenses are primarily comprised of administrative expenses, net of
revenue from externally-funded activities. IBRD and IDA's administrative budget is a single resource envelope that
funds the combined work programs of IBRD and IDA. The allocation of administrative expenses between IBRD and
IDA is based on an agreed cost and revenue sharing methodology, approved by their Boards. The allocation is
primarily driven by the relative level of activities relating to lending, knowledge services and other services between
the two institutions. The administrative expenses shown in the table below include costs related to IDA-executed trust
funds and other externally funded activities.
IDA’s net non-interest expenses on a GAAP basis were $1,392 million in FY22, compared to $1,612 million in FY21.
The key driver for the decrease was the decrease in pension costs, primarily driven by the higher asset returns in FY21,
which resulted in lower amortization of unrecognized actuarial losses in FY22.
IDA’s net non-interest expenses for adjusted net income purposes were $1,472 million in FY22, compared to $1,381
million in FY21, an increase of $91 million. FY21’s net non-interest expenses were significantly impacted by COVID-
19-related restrictions. FY22’s increase was driven by higher travel expenses due to the gradual easing of COVID-19-
related travel restrictions/office closures, inflationary cost pressures, the acceleration of work programs from the high
level of lending activities during the year as well as additional support and engagement in FCV countries to address
the growing needs and the increase in conflict situations. As a result, travel costs increased by $56 million but are still
less than what they were before the COVID-19 pandemic, approximately 38% of FY19 costs. The cost of operating
in FCV countries also affected expenses including costs associated with evacuations and security in dangerous
situations.
12.1
20.6
19.7
6.2
7.6
7.7
7.0
0
10
20
30
40
Jun 20 Jun 21 Jun 22
Concessional partner loans, at amortized cost
Market borrowings, at amortized cost
Market borrowings, at fair value

Section IV: Financial Results
June 30, 2022 21
Table 12: Net Non-Interest Expenses
In millions of U.S. dollars
For the fiscal year ended June 30,
2022
2021
Variance
Administrative expenses:
Staff costs
$
1,137
$
1,121
$
16
Travel
71
15
56
Consultant and contractual services
588
544
44
Pension and other post-retirement benefits
191
494
(303)
Communications and technology
83
68
15
Premises and equipment
144
135
9
Other expenses
24
29
(5)
Total administrative expenses
a
$
2,238
$
2,406
$
(168)
Contributions to special programs
b
19
20
(1)
Revenue from externally funded activities:
Reimbursable advisory services
(41)
(46)
5
Reimbursable revenue - IDA-executed trust funds
(613)
(553)
(60)
Revenue trust funds administration
(43)
(38)
(5)
Restricted revenue
(3)
(15)
12
Other revenue
(165)
(162)
(3)
Total revenue from externally funded activities
$
(865)
$
(814)
$
(51)
Total Net Non-Interest Expenses (Table 5) - GAAP Basis
$
1,392
$
1,612
$
(220)
Adjustments to arrive at Net non-interest expenses - Adjusted Net
Income basis
Pension, RAMP and EFO adjustments (Table 13)
c
80
(231)
311
Net non-interest expenses - Adjusted Net Income basis
$
1,472
$
1,381
$
91
a. Includes expenses related to IDA executed trust funds of $613 million for FY22 and $553 million for FY21.
b. Included in Non-interest expenses – Other in the Statement of Income.
c. Adjustments are included in the Pension and other adjustments line in Table 5. The RAMP adjustment was effective in FY22 and
made prospectively.
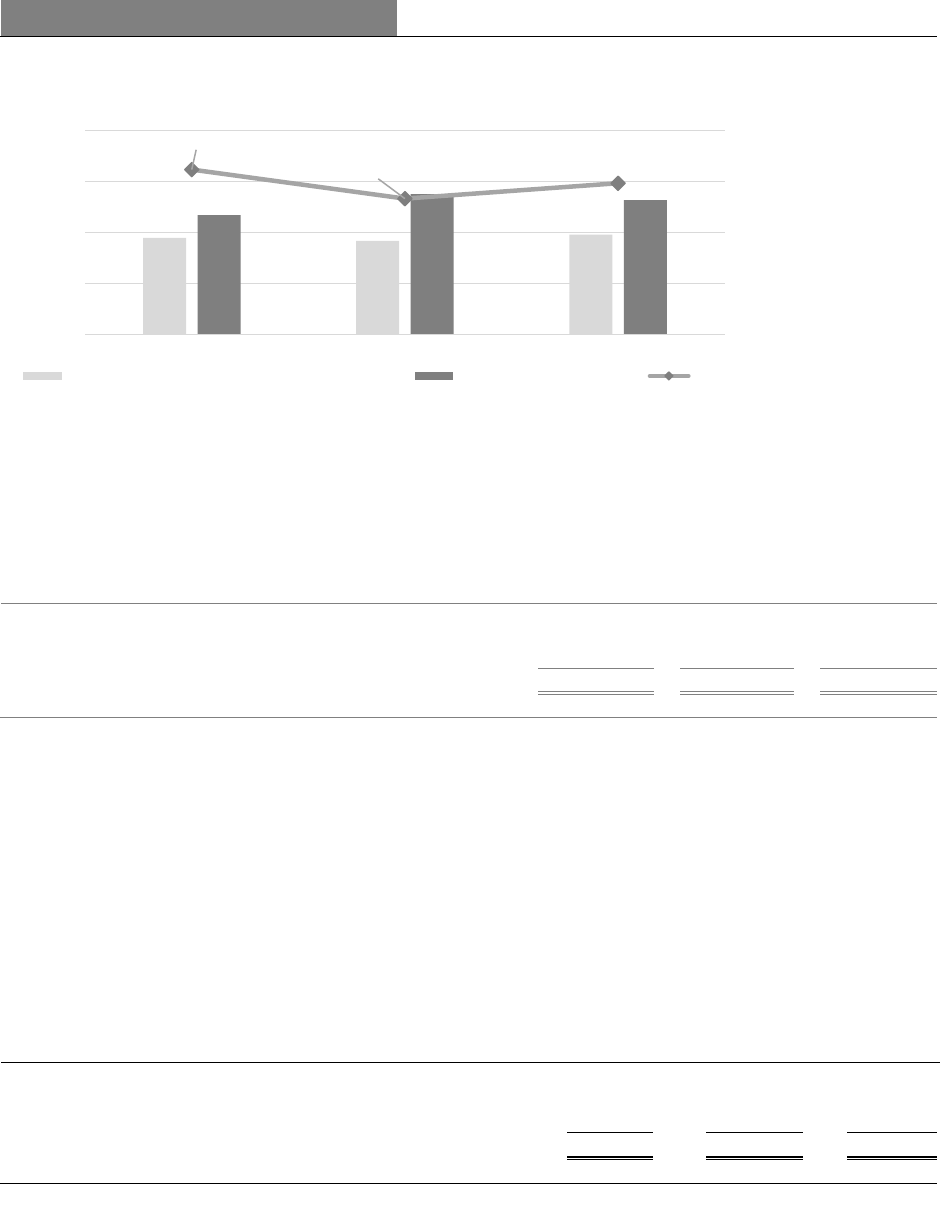
IDA’s goal is to have its net administrative expenses covered by its loan revenue (interest, service charges,
commitment fees, and guarantee fees). Thus, IDA monitors its net administrative expenses as a percentage of its loan
revenue, using a measure referred to as the budget anchor. In FY22, IDA’s budget anchor was 74.3%, higher by 7.6
percentage points compared to FY21 primarily due to the one-time effect of $244 million of service charges recognized
in FY21 when Sudan paid all its overdue principal and charges due to IDA. Excluding the impact of Sudan’s arrears
clearance of $244 million in FY21, IDA’s FY22 budget anchor improved by 1.3%. See Table 13.
Table 13: Budget Anchor
In millions of U.S. dollars
For the fiscal year ended June 30,
2022
2021
Variance
Total net Non-interest Expenses (Table 12)
$
1,392
$
1,612
$
(220)
Pension, RAMP and EFO adjustments (Table 12)
a
80
(231)
311
Net administrative expenses for Budget Anchor
$
1,472
$
1,381
$
91
Interest Revenue from Loans, net of associated borrowing expenses
$
1,892
$
2,050
$
(158)
Commitment fee and Guarantee fee revenue (Table 14)
46
36
10
Gains (losses) on revenue-hedging forward currency contracts
42
(16)
58
Total revenue for Budget Anchor
$
1,980
$
2,070
$
(90)
Budget Anchor
74.3%
66.7%
7.6%
a. These adjustments are made to arrive at net administrative expenses used for adjusted net income purposes.
Section IV: Financial Results
22 June 30, 2022
Figure 9: Budget Anchor
In millions of U.S. dollars, except ratio in percentages
In FY22, IDA’s net other expenses were $2 million as the PPA grant expenses exceeded PPA cancellations and
refinancing of PPA grants previously approved. In contrast, in FY21, IDA had $56 million of net other revenue as
PPA cancellations and refinancing of PPA grants previously approved exceeded PPA grant expenses. Refinanced PPA
grants are included in the loan provided to the borrower, and correspondingly, prior grant expenses are reversed.
Table 14: Other (Expenses) Revenue, net
In millions of U.S. dollars
For the fiscal year ended June 30,
2022
2021
Variance
PPA grants and others
$
(48)
$
20
$
(68)
Guarantee fees
22
17
5
Commitment charges
24
19
5
Other (Expenses) Revenue, net (Table 5)
$
(2)
$
56
$
(58)
Unrealized mark-to-market gains (losses) on investments- trading portfolio
IDA’s investments-trading portfolio, excluding the returns from the PEBP, had unrealized mark-to-market losses of
$67 million in FY22, compared to unrealized mark-to-market losses of $40 million in FY21. The losses in both years
were mainly due to the increase in yields on long-term euro government bonds.
Unrealized mark-to-market gains (losses) on non-trading portfolios, net
During FY22, the non-trading portfolios had $1.5 billion of net unrealized mark-to-market gains ($1.1 billion net
unrealized mark-to-market gains in FY21). The increase is mainly driven by unrealized mark-to-market gains from
the derivatives held for the CVP, managed as part of ALM, as the U.S. dollar and EUR interest rates for long tenors
increased more in FY22 compared to FY21. (Section IX: Risk Management).
Table 15: Unrealized Mark-to-Market gains (losses) on non-trading portfolios, net
In millions of U.S. dollars
For the fiscal year ended June 30
2022
2021
Variance
Asset-liability management derivatives
$
1,441
$
1,080
$
361
Investment portfolio
(26)
(12)
(14)
Other
a
59
34
25
Total
$
1,474
$
1,102
$
372
a. Other comprises mark-to-market gains (losses) on the borrowings, loan related derivatives and on PSW.
81.0%
66.7%
74.3%
0%
20%
40%
60%
80%
100%
0
750
1,500
2,250
3,000
FY20 FY21 FY22
Net administrative expenses for budget anchor Budget Anchor Revenue Budget Anchor

Section IV: Financial Results
June 30, 2022 23
Non-functional currency translation adjustment gains (losses), net
Non-functional currency translation adjustment gains or losses represent unrealized exchange rate gains or losses
resulting from the hedging of exchange rate risk related to future donor contributions, and the translation of loans,
borrowings, and all other assets and liabilities held on IDA’s Balance Sheet, that are denominated in currencies other
than the SDR and its component currencies. The translation adjustment gains and losses in FY22 and FY21 were
primarily driven by the hedging of exchange rate risk related to future donor contributions. Certain members pledge
their future equity contributions in non-SDR currencies. These future cash flows are economically hedged using
currency forwards. The economic offset is inherent in the future contribution inflows. The payable portion of the
currency forward contracts are denominated in non-functional currencies. The appreciation or depreciation of these
currencies against the U.S. dollar results in exchange rate gains or losses which are recorded in the income statement.
Accordingly, the translation adjustment gains of $511 million in FY22 were driven by the depreciation of the hedged
non-functional currencies against the U.S. dollar, while the translation adjustment losses of $372 million in FY21
were due to the appreciation of these currencies against the U.S dollar.

Section V: Development Activities, Products and Programs
24 June 30, 2022
Section V: Development Activities, Products and Programs
Lending Framework
IDA provides financing to lower-income countries primarily through loans, grants and guarantees. IDA has a common
framework which extends across all its development activities. The main elements of this framework are financing
principles, financing cycles and financing categories.
Financing Principles
IDA’s operations are required to conform to the general principles derived from its Articles of Agreement. These
principles are described in Box 2. Within the scope permitted by the Articles of Agreement, application of these
financing principles must be developed and adjusted in light of experience and changing conditions.
Financing Cycles
The process of identifying and appraising a project and approving and disbursing the funds often extends over several
years. However, in response to emergency situations, such as natural disasters and financial crises, IDA is able to
accelerate the preparation and approval cycle. In most cases, IDA’s Board approves each loan, grant, and guarantee
after appraisal of a project by staff. Under a Multiphase Programmatic Approach (MPA) approved by the Board in
FY18, the Board may approve an overall program framework, its financing envelope and the first appraised phase,
and then authorize management to appraise and commit financing for later program phases. Disbursements are subject
to the fulfillment of conditions set out in the loan or grant agreement. IDA used this approach to expedite support for
COVID-19 related projects. As of June 30, 2022, $12.0 billion was committed under the MPA, of which $6.7 billion
was COVID-19 related commitments.
During implementation of IDA-supported operations, staff review progress, monitor compliance with IDA’s policies,
and assist in resolving any problems that may arise. An independent unit, the Independent Evaluations Group, also
assesses the extent to which operations have met their major objectives, and these evaluations are reported directly to
the Board.
Financing Categories
Most of IDA’s lending is of three types: investment project financing, development policy financing, and program-
for-results. Figure 10 shows the percentage of loans approved for investment lending, development policy operations
and program-for-results over the past five years.
Box 2: Financing Principles
(i) IDA may provide financing for its development operations in the form of loans, grants, and guarantees directly to its members,
public or private entities and regional or public international organizations.
(ii) productivity, and thus
for technical, economic, financial, institutional, and environmental soundness. Specific provisions apply to development policy
financing, including the treatment of the macroeconomic framework, poverty and social impact, environment, forests, and other
natural resources.
(iii)
including assessments of its resources and ability to generate sufficient foreign currencies to meet debt-service obligations.
(iv)
requirements), the recipient would be unable to obtain financing under conditions which, in the opinion of IDA, are reasonable
for the recipient. This would include loans made by private sources or IBRD.
(v) The use of funds by recipients is supervised. IDA makes arrangements intended to ensure that funds provided are used only
for authorized purposes and, where relevant, with due attention to considerations of cost-effectiveness. This policy is enforced
nced
with the proceeds of loans or grants are made in conformity with the applicable financing agreements, and (b) to maximize
competition in the procurement of goods and services by using, wherever possible, international competitive bidding
procedures or, when it is not appropriate, other procedures that ensure maximum economy and efficiency. In addition, IDA
considers the use of recipient country procurement, financial management and environmental and social safeguard systems
in selected operations once these systems and capacity have been assessed by IDA as acceptable.
Section V: Development Activities, Products and Programs
June 30, 2022 25
Figure 10: Net Annual Commitments and share of financing categories
In billions of U.S. dollars, except rates in percentages
Investment Project Financing (IPF)
IPF provides financing for a wide range of activities aimed at creating the physical and social infrastructure necessary
to reduce poverty and create sustainable development. IPF is usually disbursed over the long-term (roughly a 5 to 10-
year horizon).
FY22 net commitments under IPF totaled $29.9 billion, compared with $24.7 billion in FY21.
Development Policy Financing (DPF)
DPF aims to support the borrower in achieving sustainable development through a program of policy and institutional
actions. Examples of DPF projects include strengthening public financial management, improving the investment
climate, addressing bottlenecks to improve service delivery, and diversifying the economy. DPF supports such reforms
through non-earmarked general budget financing. DPF provides fast-disbursing financing (roughly 1 to 3 years) to
help borrowers address actual or anticipated financing requirements.
FY22 net commitments under DPF totaled $3.4 billion, compared with $7.0 billion in FY21.
Program-for-Results (PforR)
PforR helps countries improve the design and implementation of their development programs and achieve specific
results by strengthening institutions and building capacity. PforR disburses when agreed results are achieved and
verified. Results are identified and agreed upon during the preparation stage.
FY22 net commitments under PforR totaled $4.4 billion, compared with $4.3 billion in FY21.
These three complementary categories support the policy and institutional changes needed to create an environment
conducive to sustained and equitable growth.
Financial Terms
Commitment Currency
The currency of commitment for IDA grants and concessional loans is predominantly the SDR. However, in response
to client needs to reduce currency exposure and simplify debt management, IDA offers a Single Currency Lending
option that allows IDA recipients to denominate new IDA loans in U.S. dollar, euro, pound sterling or Japanese yen.
For cumulative loans approved under Single Currency program as of June 30, 2022, see Table 16.
62
71
72
69
79
9
22
24
19
9
29
7
4
12 12
0
25
50
75
100
FY18 FY19 FY20 FY21 FY22
Percent
Investment Lending Development Policy Program-for-Results
$22
$30
$24
$36
$38

Section V: Development Activities, Products and Programs
26 June 30, 2022
Table 16: Cumulative Loans approved under the Single Currency program
In billions of U.S. dollar equivalent value
As of June 30,
2022
Euro
$
30.5
U.S. dollar
23.9
Japanese Yen
0.9
Pound Sterling
0.1
Total
$
55.4
Of the above, loans outstanding at the end of the year
$
19.7
Table 17: Summary of Financial Terms for IDA Grants and Lending Products, effective July 1, 2022
a. Prior to July 1, 2017, IDA offered Hard-Term loans to Blend Countries (excluding Small Island Economies). They had a single
currency option, and had terms equivalent to IBRD’s fixed spread loans, less 200 bps, a variable option was also available.
Hard-term loans are no longer offered.
b. There is an implicit floor of zero on the overall interest rate in IDA’s non-concessional loans.
c. The volume of committed and undisbursed CAT DDOs financed by IDA is limited to 0.5 percent of the country’s GDP or USD
250 million, whichever is lower. The CAT DDO may be renewed once, for a maximum of six years in total.
Charges on Loans and Grants
Service charges and interest income earned on IDA’s loans are reported as Interest revenue on loans, net in the
Statement of Income. Commitment charges earned on loans and grants (if any) are reported as non-interest revenue in
the Statement of Income.
Service Charge: A service charge is levied on the principal amount disbursed and outstanding on all Regular, Small
Economy, and Blend term loans, regardless of repayment terms, at 0.75% per annum.
Interest: Interest is charged on all loans subject to blend terms approved from IDA16, hard-term loans, and non-
concessional loans. Further, loans offered under non-concessional terms are available at variable interest rates on
IBRD terms. All other rates are fixed.
Commitment Charge: A commitment charge, which is payable on any undisbursed loan or grant amount, is set by
the Board at the beginning of each fiscal year. Commitment charges are set at a level to ensure that net loan revenue
covers administrative expenses over the medium term. From FY09 to FY22, the commitment charge on undisbursed
concessional loans had been set at zero, and for grants it had been set at zero from FY03 to FY22. For FY23,
Instrument type
a
Currencies
Maturity/Grace
Period
Current Charges
Interest rates
Grant
SDR
Not applicable
Not applicable
Not applicable
Regular-Term loan
SDR, USD, EUR,
GBP, JPY
38/6 years
75bps SDR equivalent
service charge
Not applicable
Regular-Small Economy
loan
SDR, USD, EUR,
GBP, JPY
40/10 years
75bps SDR equivalent
service charge
Not applicable
Blend-Term loan
SDR, USD, EUR,
GBP, JPY
30/5 years
75bps SDR equivalent
service charge
1.25% SDR equivalent
interest rate
50-year loan
SDR, USD, EUR,
GBP, JPY
50/10 years
Zero interest and
service charge
Zero interest and service
charge
Shorter Maturity Loan (SML)
SDR, USD, EUR,
GBP, JPY
12/6 years
Zero interest and
service charge
Zero interest and service
charge
Non-concessional loans -
Scale-up Window (SUW)
USD, EUR, GBP,
JPY
Up to 35 years
maximum; up to 20
years average
maturity
25 bps one-time front-
end fee
25 bps commitment fee
IBRD Flexible Loan
terms
b
Catastrophe Deferred Draw
Down Option (CAT DDO)
c
SDR, USD, EUR,
GBP, JPY
Before Drawdown: Front end fee and renewal fee are set at 0.5% and
0.25% respectively under SUW option, and at 0% under PBA or Undisbursed
balances option.
After Drawdown:
- Under PBA or Undisbursed balances option - IDA concessional rates
would apply.
- Under SUW option - non-concessional rates would apply.

Section V: Development Activities, Products and Programs
June 30, 2022 27
commitment charges remain set at zero, the same level as FY22. The commitment charge on non-concessional loans
is aligned to IBRD terms, which include a commitment charge of 0.25%.
Repayment Terms
Loans approved through June 30, 1987 have a final maturity of 50 years, including a grace period of 10 years. In
recent replenishments, differentiation in IDA’s lending terms has been introduced to recognize the variation in
economic development of broad categories of IDA recipients.
Since 1987, the legal agreements of regular, blend and hard-term loans include an accelerated repayment clause to
double the principal repayments of the loan if the borrower’s GNI per capita exceeds a specific threshold and the
borrower is eligible for IBRD financing. Implementation is subject to negotiation with the borrower and approval by
IDA’s Board after considering a borrower’s economic development. The borrower can further negotiate either to (a)
shorten the loan’s maturity (principal option), (b) pay interest at a rate that would result in the same net present value
(interest option), or a combination of the two options.
As of June 30, 2022, the acceleration clause was implemented for the qualifying loans of 18 borrowers that have
graduated from IDA since the introduction of the accelerated repayment clause. Of these 18 borrowers, 11 borrowers
selected the principal option, 6 borrowers selected the interest option, and one borrower selected a combination of the
two options.
The accelerated repayment clauses in all of these legal agreements also allow a borrower to subsequently request
pausing of those accelerated terms if economic conditions in the borrower’s country have deteriorated, in which case,
the terms of repayment can revert to the original terms of the financing agreements. As repayment accelerations, and
pausing of accelerations, are contemplated in the original terms of the instruments, they do not constitute loan
modifications. Given the challenging economic situation as a result of the COVID-19 outbreak, for ten graduate
countries whose accelerated repayments were approved by the Board for implementation in IDA17 and IDA19,
management approved a one-year pause, which became effective July 1, 2020, of the accelerated payment terms to
conform to the schedule originally provided in their financing agreements. Subsequently, this was extended for an
additional year for five graduate countries. As of June 30, 2022, $16.2 billion of loans outstanding were under the
accelerated repayment terms.
Loans, Grants and Guarantee Activity
Commitments
FY22 net loan commitments were $24.5 billion, an increase of $0.6 billion or 2% over FY21 ($23.9 billion), mainly
driven by higher IPF commitments. There were no guarantee commitments in both FY22 and FY21. (See Table 18).
Also, see Section VI: Other Development Activities and Programs.
FY22 Net commitments of grants were $13.2 billion, an increase of $1.1 billion or 9% over FY21 ($12.1 billion). (See
Table 19).
Table 18: Net Commitments of Loans by Region
In millions of U.S. dollars
For the fiscal year ended June 30,
2022
% of total
2021
% of total
Variance
Eastern and Southern Africa
$
7,751
32
$
7,105
30
$
646
Western and Central Africa
8,779
36
7,900
33
879
East Asia and Pacific
1,039
4
1,003
4
36
Europe and Central Asia
2,046
8
966
4
1,080
Latin America and the Caribbean
534
2
622
3
(88)
Middle East and North Africa
162
1
20
*
142
South Asia
4,183
17
6,291
26
(2,108)
Total
$
24,494
100
$
23,907
100
$
587
* Indicates percentage less than 0.5%.

Section V: Development Activities, Products and Programs
28 June 30, 2022
Table 19: Net Commitments of Grants by Region
In millions of U.S. dollars
For the fiscal year ended June 30,
2022
% of total
2021
% of total
Variance
Eastern and Southern Africa
$
7,515
57
$
6,984
58
$
531
Western and Central Africa
3,434
26
3,055
25
379
East Asia and Pacific
634
5
112
1
522
Europe and Central Asia
465
3
349
3
116
Latin America and the Caribbean
496
4
147
1
349
Middle East and North Africa
655
5
638
5
17
South Asia
34
*
836
7
(802)
Total
$
13,233
100
$
12,121
100
$
1,112
* Indicates percentage less than 0.5%.

Section VI: Other Development Activities and Programs
June 30, 2022 29
Section VI: Other Development Activities and Programs
IDA has products, services, and programs, other than lending, that it offers to its borrowing member countries to help
them meet their development goals. These include guarantees, debt relief, trust fund administration, and externally
funded reimbursable advisory services.
Guarantees
IDA offers both project-based and policy-based guarantees. These guarantees are available for projects and programs
in member countries to help mobilize private financing for development purposes. IDA’s guarantees are partial in
nature as they are intended to cover risks only to the extent necessary to obtain the required private financing, taking
into account country, market and, if appropriate, project circumstances. IDA’s guarantees require a sovereign counter-
guarantee and indemnity, comparable to the requirement of a sovereign guarantee for IDA lending to sub-sovereign
and non-sovereign borrowers. See Table 20 for the types of guarantees that IDA provides. These guarantees are
separate and distinct from those offered under the Private Sector Window. The Corporate Risk Guarantee Committee
reviews the choice of instrument for all proposed new guarantee operations.
Table 20: Types of Guarantees
Project-based
guarantees
Project-based guarantees are provided to mobilize private financing for a project and/or mitigate payment
and/or performance related risks of a project. There are two types:
1. Loan guarantees: these cover loan-
to meet specific payment and/or performance obligations arising from contract, law, or regulation. Loan
guarantees include coverage for debt service defaults on: (i) commercial debt, normally for a private
sector project; and (ii) a specific portion of commercial debt irrespective of the cause of such default,
normally for a public-sector project.
2. Payment guarantees: These cover payment default on non-loan related government payment
obligations to private entities and foreign public entities arising from contract, law, or regulation.
Policy-based
guarantees
Policy-based guarantees are provided to mobilize private financing for sovereigns or sub-sovereigns. They
cover debt service default, irrespective of the cause of such default, on a specific portion of commercial debt
actions.
Table 21: Pricing for IDA Project-Based and Policy-Based Guarantees, effective July 1, 2022
Charges
Guarantees on Concessional Terms
Guarantees on Non-Concessional Terms
Private Projects
Public Projects
Private Projects
Public Projects
Front-end fee
N.A.
N.A.
25 bps
25 bps
Initiation fee
a
15 bps
N.A.
15 bps
N.A.
Processing fee
b
Up to 50 bps
N.A.
Up to 50 bps
N.A.
Standby fee
0 bps
0 bps
25 bps
25 bps
Guarantee fee
75 bps
75 bps
50-100 bps
c
50-100 bps
c
a. The Initiation fee is 15 basis points of the guaranteed amount or $100,000, whichever is greater.
b. The processing fee is determined on a case-by-case basis.
c. Based on the weighted average maturity of the guarantee.
Guarantee Exposure
IDA’s guarantee exposure is measured by discounting each guaranteed amount from its next call date. See Table
below for IDA’s guarantee exposure and maximum potential undiscounted future payments that IDA could be required
to make under these guarantees. In addition, IDA had $638 million of exposure under PSW guarantees as of June 30,
2022 ($484 million — June 30, 2021). See Section III: IDA’s Financial Resources. For additional information, see
Notes to the Financial Statements for the year ended June 30, 2022, Notes D – Loans and Other Exposures and Note
G – Transactions with Affiliated Organizations.
In millions of U.S. dollars
As of June 30,
2022
2021
Guarantee Exposure
$
1,845
$
1,998
Maximum potential undiscounted future payments
1,869
2,029

Section VI: Other Development Activities and Programs
30 June 30, 2022
Other Financial Products and Services
IDA facilitates access to risk management solutions to mitigate the financial effects of natural disasters for borrowing
members. Financial solutions can include disaster risk financing through catastrophe swaps, insurance and reinsurance
contracts, and regional pooling facilities.
In order to promote countries’ resilience to disasters and expand the range of IDA’s crisis instruments, in IDA18,
members endorsed the introduction of the Catastrophe Deferred Draw-Down Option (CAT-DDO). The CAT-DDO is
a contingent credit line that provides immediate liquidity to countries in the aftermath of a catastrophe and serves as
early financing while funds from other sources such as bilateral aid or reconstruction loans are being mobilized. CAT-
DDOs are intended to enhance IDA countries’ capacity to plan for and manage crises. As of June 30, 2022, the amount
of CAT DDOs disbursed and outstanding was $359 million (compared to $388 million as of June 30, 2021), and the
undisbursed amount of effective CAT DDOs was $53 million, compared to $56 million a year earlier.
Grant Making Facilities
Grant-Making Facilities (GMFs) are complementary to IDA’s work. In FY22, IDA recorded $19 million under this
program in accordance with the cost sharing agreement with IBRD (FY21 - $20 million). These amounts are reflected
in Non-Interest Expenses - Other in IDA’s Statement of Income.
Debt Relief
The Heavily Indebted Poor Countries Debt Initiative (HIPC Initiative) was launched in 1996 as a joint effort by
bilateral and multilateral creditors to provide debt relief to the poorest countries to reduce their external debt payments
to sustainable levels. Under the HIPC initiative, implementation mechanisms include partial forgiveness of IDA debt
service as it comes due and partial repayment with IDA resources of outstanding IBRD debt. The Multilateral Debt
Relief Initiative (MDRI) was implemented in 2006 and provides debt relief by writing-off of eligible loans upon
qualifying borrowers reaching the HIPC Completion Point. Both of the initiatives are part of a global effort focused
on heavily indebted poor countries with strong policy performance. The initiatives aim to reduce the external debt of
eligible countries as part of a broader poverty reduction strategy, whilst safeguarding the long-term financial capacity
of IDA and other participating multilateral institutions; and encouraging the best use of additional member resources
for development, by allocating these resources to low-income countries on the basis of policy performance.
In order to receive irrevocable debt relief, eligible countries are required to maintain macroeconomic stability, carry
out key structural and social reforms, and implement a Poverty Reduction Strategy, in addition to being in good
standing with respect to all eligible debt repayments. To ensure IDA’s financial capacity was not eroded, members
agreed to compensate IDA with additional contributions to offset the impact of the forgone reflows, resulting from
the provision of debt relief.
The accumulated provision for debt relief was recorded at the inception of the initiative and is based on both
quantitative and qualitative analyses of various factors, including estimates of the Decision and the Completion Point
dates. These factors are periodically reviewed, and the adequacy of the accumulated provision is reassessed and
adjusted to reflect the impact of any changes.
During FY22, HIPC debt relief was provided on $30 million of loans ($9 million in FY21). There was no HIPC debt
relief on service charges in FY22 or FY21. On a cumulative basis, debt relief has been provided on $2.2 billion of
loans and $335 million of service charges under HIPC as of June 30, 2022.
During FY22 and FY21, there was no cancellation of eligible loans under MDRI. On a cumulative basis, debt relief
has been provided on $40.2 billion of loans under the MDRI as of June 30, 2022. The provision for the debt relief was
recorded at the beginning of the MDRI Initiative.
Externally-Funded Activities
Mobilization of external funds from third-party partners includes trust funds. Additional external funds include
reimbursable funds and revenues from fee-based services to member countries, which are related to Reimbursable
Advisory Services (RAS), and EFO.
Trust Fund Activity
Trust Funds are a part of the WBG’s development activities, providing resources and added flexibility in providing
development solutions that serve member recipients and donors alike. The partnerships funded by trust funds often
serve as a platform from which IDA and its members can draw on the WBG’s diverse technical and financial resources

Section VI: Other Development Activities and Programs
June 30, 2022 31
to achieve development goals that cannot be addressed effectively by any single member, given their complexity,
scale, and scope.
IDA’s roles and responsibilities in managing trust funds depend on the type of fund, outlined as follows:
IDA-Executed Trust Funds (BETFs): IDA, alone or jointly with one or more of its affiliated organizations, manages
the funds and implements the activities financed. These trust funds support IDA’s work program. IDA, as an executing
agency, disbursed $613 million in FY22 ($553 million in FY21) of trust fund program funds.
Recipient-Executed Trust Funds (RETFs): Funds are provided to a third party, normally in the form of project grant
financing, and are supervised by IDA.
Financial Intermediary Funds (FIFs): IDA, as a trustee, administrator, or treasury manager, offers specific
administrative or financial services with a limited operational role. Arrangements include the administration of debt
service trust funds, fiscal agency funds and other more specialized limited fund management roles.
IDA uses a cost recovery framework for trust funds, which aims to recover the costs of performing agreed roles in
administrating trust funds, and is guided by principles of transparency, fairness, simplification, standardization,
predictability, and consistent treatment across all trust fund donors.
Management continues to implement measures to better integrate planning, support sustainability and enhance
alignment of External Funds with mission priorities through greater use of umbrella trust fund programs, increased
cost recovery, and new budgetary planning measures to manage External Funds usage.
During FY22, IDA’s share of revenue and fees from Trust Fund administration activity was $43 million ($38 million
in FY21). For additional information, see Notes to the Financial Statements for the year ended June 30, 2022, Note
H-Trust Funds Administration.
As noted in the discussion of Trust Fund activities above, IDA, alone or jointly with one or more of its affiliated
organizations, administers on donors’ behalf funds restricted for specific uses. Such administration is governed by
agreements with donors, who include members, their agencies, and other entities. These funds are held in trust and
are not included on IDA’s Balance Sheet, except for $707 million of undisbursed third-party contributions made to
IDA-executed trust funds, which are recognized on the Balance Sheet. These amounts are included in Other assets
and the corresponding liabilities are included in Accounts payable and miscellaneous liabilities on the Balance Sheet.
The cash and investment assets held in trust by IDA as administrator and trustee as of June 30, 2022, and June 30,
2021, are summarized in Table 22.
Table 22: Cash and Investment Assets Held in Trust by IDA
In millions of U.S. dollars
Total Fiduciary Assets
As of June 30,
2022
2021
IDA-executed
$
38
$
44
Jointly executed with affiliated organization
1,004
1,025
Recipient-executed
1,855
2,365
Financial intermediary funds
285
286
Execution not yet assigned
a
5,800
5,365
Total
$
8,982
$
9,085
a. These represent assets held in trust for which the determination as to the type of execution is yet to be finalized.
Reimbursable Advisory Services (RAS)
While most of IDA’s advisory and analytical work is financed by its own budget or donor contributions (e.g., trust
funds), clients may also pay for services. IDA offers technical assistance and other advisory services to its member
countries, in connection with, and independent of, lending operations. Available services include, for example,
assigning qualified professionals to survey developmental opportunities in member countries; analyzing member
countries fiscal, economic, and developmental environments; helping members devise coordinated development
programs; and improving their asset and liability management techniques. In FY22, income relating to reimbursable
advisory services was $41 million (FY21 - $46 million).

Section VI: Other Development Activities and Programs
32 June 30, 2022
Externally Financed Outputs (EFOs)
IDA offers donors the ability to contribute to specific projects and programs. EFO contributions are recorded as
restricted revenue when received because they are for contractually specified purposes. IDA received and recorded $3
million of restricted revenue in FY22 (FY21 - $15 million), which was included in net non-interest expenses – GAAP
basis. See Table 12.
Restrictions are released once the funds are used for the purposes specified by donors. In FY22, there was a release of
$17 million (FY21 - $21 million).

Section VII: Investment Activities
June 30, 2022 33
Section VII: Investment Activities
As of June 30, 2022, IDA’s net investment portfolio totaled $39.6 billion (Figure 11). See the Notes to the Financial
Statements for the year ended June 30, 2022, Note C – Investments.
Figure 11: Net Investment Portfolio
In billions of U.S. dollars
Investments Trading Portfolio
The primary objective of IDA’s investments-trading portfolio strategy continues to be preservation of capital within
institutional constraints. Consistent with this primary objective, IDA invests in high quality instruments. IDA aims to
earn reasonable investment returns, while ensuring timely availability of funds for future cash flow requirements,
including disbursements for loans, grants, debt service, and administrative expenses.
Table 23: Investments-Trading Portfolio Composition
In millions of U.S. dollars
As of June 30,
2022
2021
Investments-trading portfolio
Operational
$
15,929
$
12,836
Stable
22,734
24,598
Discretionary
552
-
Total
$
39,215
$
37,434
As of June 30, 2022, $31.0 billion (approximately 80% of total volume) was due to mature within six months, of
which $12.3 billion was expected to mature within one month.
IDA’s total return on its investments-trading portfolio for FY22 (excluding unrealized mark-to-market gains / losses
on PEBP assets) was 0.26%, compared to 0.25% in FY21, primarily due to higher interest revenue resulting from
increase in both average interest rates and average portfolio balance in FY22, partially offset by higher unrealized
mark-to-market losses in FY22 compared to FY21. The unrealized mark-to-market losses in FY22 primarily reflected
the increase in yield curves of long-term EUR government bonds during the year.
Table 24 provides a breakdown of the average balances and returns of IDA’s investments-trading portfolio. For details
on returns of the total portfolio, refer to Section IV: Financial Results.
Table 24: Average Balances and Returns by Sub-Portfolio
In millions of U.S. dollars, except rates in percentages
FY22
FY21
Sub Portfolios
Average Balance
Return
Average Balance
Return
Operational
$
16,136
0.25%
$
9,557
0.23%
Stable
23,959
0.26%
25,708
0.23%
Discretionary
a
167
-
87
0.26%
Total
$
40,262
0.26%
$
35,309
0.25%
a. Discretionary portfolio was discontinued between December 2020 and September 2021.
35.0
37.4
39.2
0.6
0.5
0.4
0
10
20
30
40
Jun 20 Jun 21 Jun 22
Trading Portfolio Non-trading Portfolio

Section VII: Investment Activities
34 June 30, 2022
IDA’s liquid assets are mainly held in the following types of highly rated, fixed-income instruments. See Table 29 for
eligibility criteria for IDA’s investments.
• Government and Agency Obligations.
• Time deposits, and other unconditional obligations of banks and financial institutions.
• Asset-backed securities (including mortgage-backed securities).
• Currency and interest rate derivatives (including currency forward contracts).
• Exchange-traded options and futures.
IDA’s prudential minimum liquidity policy ensures that it holds sufficient liquidity. The prudential minimum liquidity
level is set at 80% of 24 months of projected net outflows. For FY22, the prudential minimum was $19.3 billion. The
prudential minimum for FY23 has been set at $20.8 billion. See Section IX: Risk Management for details on how IDA
manages liquidity risk.
Investments - Non-Trading Portfolio
During FY15, with the proceeds of a concessional loan from a member, IDA purchased a debt security issued by the
IFC. IDA elected to measure the security at fair value, so that the measurement method could be consistently applied
to all its investments. The changes in fair value for this security are reflected in the Statement of Income. As of June
30, 2022, the investments non-trading portfolio had a fair value of $346 million ($487 million in FY21). See Notes to
the Financial Statements for the year ended June 30, 2022, Note C – Investments.

Section VIII: Borrowing Activities
June 30, 2022 35
Section VIII: Borrowing Activities
Concessional Partner Loans
Concessional partner loans (CPL) continue as a source of funding, whereby the borrowing terms of the concessional
loans from members aim to follow the concessional features of IDA’s loans.
The maturities of the CPL are either 25 or 40 years to match the terms of IDA’s loans, with a grace period of 5 years
for a 25-year loan and 10 years for the 40-year loan. In addition, beginning in FY22, IDA had CPL with maturity of
50 years and a grace period of 10 years. The loans have an all-in SDR equivalent coupon of up to one percent.
Voting rights are allocated to members who provide concessional loans following the drawdowns by IDA, and are
based on the cash paid, computed as the derived grant element of the loan. The grant element, which is paid in cash
and recorded as equity, is a function of the terms of the loan and the discount rate agreed upon during the replenishment
discussions.
SDR Discount rates
Maturity
Grace period
IDA19
IDA20
25-year
5 years
2.25%
1.41%
40-year
10 years
2.57%
1.79%
50-year
10 years
-
1.84%
The decrease of $0.7 billion in concessional partner loans outstanding was primarily due to translation adjustment
gains. Interest expense associated with these loans was $144 million in FY22 (FY21 - $149 million). See Table 25.
Market Debt
IDA started to issue bonds in the international capital markets in 2018. In FY22, IDA continued to extend its
benchmark curve and issued bonds with longest maturity of 20 years. As of June 30, 2022, market borrowings recorded
at fair value were $19.7 billion, a decrease of $0.9 billion compared to June 30, 2021, primarily due to translation
gains during the year. Beginning in July 2021, IDA issued long-term fixed rate bonds recorded at amortized cost to
fund its fixed rate loans. See Table 25.
Table 25: Borrowings
In millions of U.S. dollars, except rates in percentages
Outstanding as of June 30,
Interest expense
a
Weighted average rate
2022
2021
FY22
FY21
FY22
FY21
Market debt, at fair value
$
19,718
$
20,555
$
152
$
95
1.00%
0.65%
Market debt, at amortized cost
6,201
-
14
-
0.86%
-
Concessional partner loans
6,980
7,759
144
149
1.99%
1.90%
Total
$
32,899
$
28,314
$
310
$
244
1.17%
0.99%
a. Excludes interest revenue/expenses associated with borrowings swaps and repurchase agreements - $61 million in FY22 (FY21–
$57 million).
IDA uses currency and interest rate derivatives in connection with its borrowings for asset and liability management
purposes. For more details, see Section IX: Risk Management.
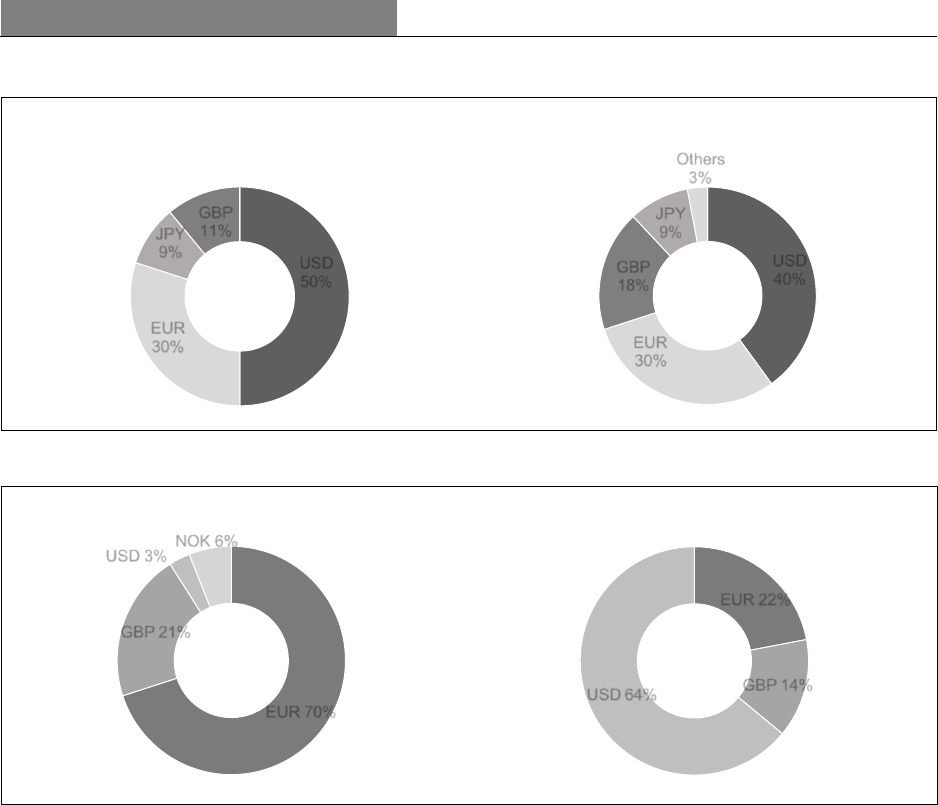
Section VIII: Borrowing Activities
36 June 30, 2022
Figure 12: Effect of Derivatives on Currency Composition of the Borrowing PortfolioJune 30, 2022
Borrowings including Derivatives
Borrowings excluding Derivatives
Figure 13: Medium- and Long-Term Borrowings Issued by Currency during the year, excluding Derivatives
June 30, 2022
June 30, 2021
Other Short-Term Borrowings
Under its Investment Guidelines, IDA is allowed to enter into transactions involving securities sold under repurchase
agreements and securities lent under securities lending agreements. These transactions are accounted for as short-term
borrowings. The agreements are secured predominantly by high quality collateral, including government issued debt,
and are used both to enhance returns and for liquidity management purposes.
As of June 30, 2022, and June 30, 2021, there were no securities sold under repurchase agreements or any securities
lent under securities lending agreements. During FY22, the securities sold under repurchase agreements or any
securities lent under securities lending agreements were immaterial with the weighted average rate of 0.04%. In FY21,
the average monthly balance during the year was $9 million and the maximum month-end balance was $107 million
with the weighted average rate of 0.16%.
Contractual Obligations
In conducting its business, IDA takes on contractual obligations that may require future payments mainly associated
with IDA’s borrowings. See Notes to the Financial Statements for the year ended June 30, 2022, Note E – Borrowings
– Table E6. These contractual obligations exclude the following obligations reflected on IDA’s balance sheet:
undisbursed loans, amounts payable for currency and interest rate swaps, amounts payable for investment securities
purchased, guarantees, and cash received under agency arrangements.
USD
50%
EUR
30%
JPY
9%
GBP
11%
USD
40%
EUR
30%
GBP
18%
JPY
9%
Others
3%
EUR 22%
GBP 14%
USD 64%
EUR 70%
GBP 21%
USD 3%
NOK 6%
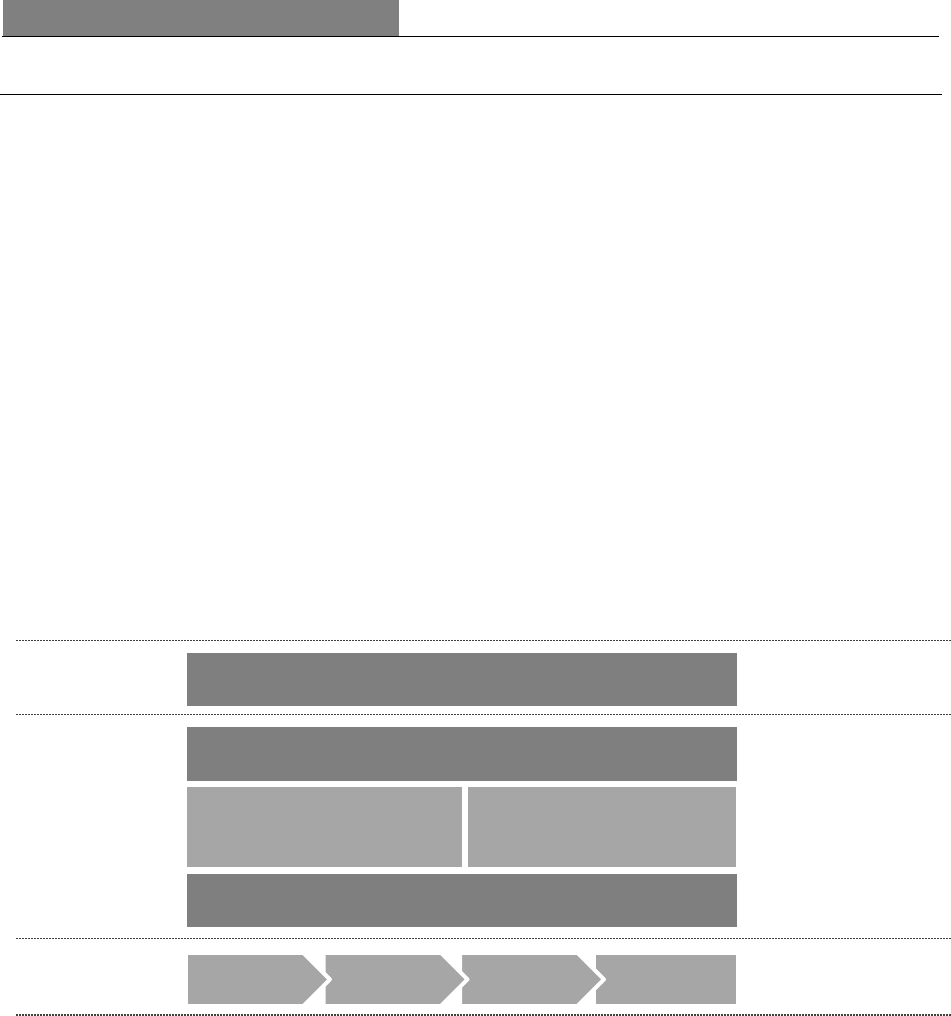
Section IX: Risk Management
June 30, 2022 37
Section IX: Risk Management
Risk Governance
IDA’s risk management processes and practices continually evolve to reflect changes in activities in response to
market, credit, product, operational, and other developments. The Board, particularly Audit Committee members,
periodically review trends in IDA’s risk profiles and performance, and any major developments in risk management
policies and controls.
Management believes that effective risk management is critical for IDA’s overall operations. Accordingly, the risk
management governance structure is designed to manage the principal risks IDA assumes in its activities, and supports
management in its oversight function, particularly in coordinating different aspects of risk management and in
connection with risks that are common across functional areas.
IDA’s financial and operational risk governance structure is built on the “three lines model” where:
• Business units are responsible for directly managing risks in their respective functional areas,
• The Vice President and WBG Chief Risk Officer (CRO) provides direction, challenge, and oversight over
financial and operational risk activities, and
• Internal Audit provides independent oversight.
IDA’s risk management process comprises risk identification, assessment, response, and risk monitoring and
reporting. IDA has policies and procedures under which risk owners and corporate functions are responsible for
identifying, assessing, responding to, monitoring, and reporting risks.
Figure 14: Financial and Operational Risk Management Structure
Risk Oversight and Coverage
Financial and Operational Risk Management
The CRO oversees both financial and operational risks. These risks include (i) country credit risks in the core sovereign
lending business, (ii) market and counterparty risks including liquidity risk, and (iii) operational risks relating to
people, processes, and systems, or from external events. In addition, the CRO works closely with IBRD, IFC, and
MIGA’s management to review, measure, aggregate, and report on risks and share best practices across the WBG.
The CRO also helps enhance cooperation between the entities and facilitates knowledge sharing in the risk
management function.
The risk of IDA’s operations not meeting the expected development outcomes (development outcome risks) in IDA’s
lending activities is monitored at the corporate level by Operations Policy and Country Services (OPCS). Where fraud
and corruption risks may impact IDA-financed projects, OPCS, the Regions and Practice Groups, and the Integrity
Vice Presidency jointly address such issues.
CRO
Financial Risk Operational Risk
Business Units
Monitor and
Report
Respond
Assess
Internal Audit
1
st
Line
2
nd
Line
3
rd
Line
Identify
Risk Process
Risk Coverage
Risk Oversight
Risk Owners

Section IX: Risk Management
38 June 30, 2022
The following three departments report directly to the CRO:
Credit Risk Department
• Identifies, measures, monitors, and manages country credit risk faced by IDA. By agreement with the Board, the
individual country credit risk ratings are not shared with the Board and are not made public.
• Assesses loan portfolio risk and capital requirements, determines the adequacy of provisions for losses on loans
and other exposures, and monitors borrowers that are vulnerable to crises in the near term. The department
assesses the consistency of country lending programs as determined in IDA’s PBA allocation framework with
overall capital adequacy.
• Reviews proposed new financial products for any implications for country credit risk.
Market and Counterparty Risk Department
• Responsible for market, liquidity, and counterparty credit risk oversight, assessment, and reporting. It does these
in coordination with IDA’s financial managers who are responsible for the day-to-day execution of trades for the
liquid asset and derivative portfolios, within applicable policy and guideline limits.
• Ensures effective oversight, including: i) maintaining sound credit assessments, ii) addressing transaction and
product risk issues, iii) providing an independent review function, iv) monitoring market and counterparty risk in
the investment, borrowing and client operation portfolios, and v) implementing the model risk governance
framework. It also provides reports to the Audit Committee and the Board on the extent and nature of risks, risk
management, and oversight.
Operational Risk Department
• Provides direction and oversight for operational risk activities by business function.
• Key operational risk management responsibilities include: (i) administering the Operational Risk Committee
(ORC) for IDA, (ii) implementing the operational risk management framework which is aligned with Basel
principles and provides direction to business unit partners to ensure consistent application, (iii) assisting and
guiding business units in identifying and prioritizing significant operational risks and enabling monitoring and
reporting of risks through suitable metrics (or risk indicators), (iv) helping identify emerging risks and trends
through monitoring of internal and external risk events, (v) supporting risk response and mitigating actions, and
prepares a corporate Operational Risk Report for review and discussion by the ORC.
• Responsible for business continuity management, and enterprise risk management functions and corporate
insurance.
Risk Committees
Figure 15: Management Risk Committee Structure for Financial and Operational Risks
Financial Risk Committees:
The Finance and Risk Committee (FRC), a Vice President level committee, provides a high-level governance
structure for decisions that may have financial risks. The FRC is chaired by the Managing Director and WBG Chief
Financial Officer (MDCFO) and approves, clears, or discusses: (a) policy and procedure documents related to financial
integrity, income sustainability and balance sheet strength, and (b) issues and new business initiatives with policy
implications related to IDA’s financial and operational risks in the areas of finance, which include country credit,
Operational Risk
Financial Risk
FRC
Finance and Risk Committee
Chair: MDCFO
NBC
New Business Committee
ERC
Enterprise Risk Committee
Chair: MDCAO
ORC
Operational Risk Committee
ALCO
Asset and Liability
Management Committee
Chair: MDCFO

Section IX: Risk Management
June 30, 2022 39
market, counterparty, liquidity, and model risks, and operational risks related to the finance business functions. The
FRC helps to integrate individual components of finance and risk management activities by building on mechanisms
and processes already in place and provides a forum for discussing and communicating significant risk related issues.
The FRC meets regularly to discuss the new products and services and financial risk management of IDA.
The New Business Committee (NBC) is a standing subcommittee of the FRC. The NBC provides advice, guidance,
and recommendations to the FRC, by performing due diligence over new financial products or services to ensure that
management has a full understanding of the rationale, costs, risks and rewards of the product or service being
considered.
Asset Liability Management Committee (ALCO), a Vice President level committee chaired by the MDCFO
provides a high-level forum to ensure prudent balance sheet management of IDA by: a) monitoring its financial
positions and ALM activities for compliance with its respective guidelines, policies and procedures, including
borrowing and investment activities; b) identifying and providing recommendations on emerging ALM issues for
IDA, as well as those related to capital, balance-sheet planning, and financial sustainability; and c) serving as
reviewing and recommending body for ongoing decisions as part of implementing the ALM policies and procedures
of IDA, including those that impact lending rates and net income.
Operational Risk Committees:
The Enterprise Risk Committee (ERC) is a Vice President-level committee chaired by the Managing Director and
Chief Administrative Officer (MDCAO) that oversees IDA’s non-financial risks through reviewing, discussing and/or
formulating proposed policies, procedures, directives, guidance, and other matters. ERC’s scope comprises of: a)
operational risk, including business continuity, corporate security, cyber security, and IT service continuity; b)
enterprise risk; c) Integrity Vice Presidency (INT) and Ethics and Business Conduct (EBC) policies and
methodologies; d) shared services; and e) any other matters brought by the MDCAO. The ERC leverages existing risk
management mechanisms that are in place to provide a corporate view of operational and non-financial risks.
Operational Risk Committee (ORC) is the main governance committee for operational risk and provides a mechanism
for an integrated review and response across IDA units on operational risks associated with people, processes, and
systems or from external events and recognizing that business units remain responsible for managing operational risks.
The Committee’s key responsibilities include monitoring significant operational risk matters and events on a quarterly
basis to ensure that appropriate risk-response measures are taken and reviewing and concluding on IDA’s overall
operational risk profile. The ORC is chaired by the CROVP and escalates significant risks and decisions to the FRC
and ERC.
Management
IDA assumes financial risks in order to achieve its development and strategic objectives. IDA’s financial risk
management framework is designed to enable and support the institution in achieving its goals in a financially
sustainable manner. IDA manages credit, market, and operational risks for its financial activities which include
lending, borrowing, and investing (Table 26). The primary financial risk to IDA is the country credit risk inherent in
its loan and guarantee portfolio. IDA is also exposed to risks in its liquid asset and derivative portfolios, where the
major risks are interest rate, exchange rate, commercial counterparty, and liquidity risks. IDA’s operational risk
management framework is based on a structured and uniform approach to identify, assess, and monitor key operational
risks across business units.

Section IX: Risk Management
40 June 30, 2022
Table 26: Summary of IDA's Specific Risk Categories
Geopolitical events and COVID-19
Ukraine
The war in Ukraine that began in February 2022 has negatively impacted regional and global financial markets and
economic conditions. It has also created significant needs for humanitarian and other critical support.
On April 29, 2022, IDA’s Board approved an increase of the IDA19 commitment authority by $1 billion to support
Ukraine, a country without eligibility for IDA financing, on an exceptional basis. This $1 billion extraordinary
financing will be on non-concessional terms and carry a shorter maturity to provide fast-disbursing support for
sustaining institutional and civil service capacity. As of June 30, 2022, $26 million had been disbursed. As of June
30, 2022, IDA had no lending operations or other exposures to the Russian Federation.
COVID-19
As a result of the ongoing COVID-19 pandemic, IDA continues to respond to client needs and operate its core business
functions effectively by utilizing technology for remote work, where needed. IDA will continue to prioritize the health
and safety of its staff through mitigation measures, including vaccination, masking, and testing.
As of June 30, 2022, despite the broad impact of geopolitical events and the COVID-19 pandemic on macroeconomic
conditions, IDA had sufficient resources to meet its liquidity requirements and continues to have access to capital
market resources. IDA continues to maintain a robust liquidity position and flexibility to access the necessary liquidity
resources. Management remains vigilant in assessing funding needs in the medium and longer-term to manage the
effect of possible severe market movements.
IDA’s capital remains adequate and above the zero percent policy minimum as indicated by the DSC ratio (Table 27).
As of the reporting date, country credit risk and counterparty credit risk remain in line with the existing governance
framework and established credit limits. The loan loss provisions include IDA’s current assessment of country credit
risk. The fair values of related financial instruments reflect counterparty credit risk in IDA’s portfolios. Developments
in the market continue to be closely monitored and managed.
IDA continues to monitor associated risks and will mitigate its exposures and risks in line with the existing risk
governance framework.
Capital Adequacy
IDA uses a solvency-based capital adequacy model, which mandates that IDA hold capital for credit risk, market risk
and operational risk covering all activities and assets on its books. The main measure of capital adequacy is DSC, a
non-GAAP measure, which is the capital available to support future commitments, over and above the current
portfolio. IDA is required, by the Board, to keep the DSC at levels greater than or equal to zero percent. The DSC is
calculated as the amount by which Total Resources Available (TRA) exceed Total Resources Required (TRR), plus a
Conservation Buffer (CB). The TRA consists of IDA’s existing equity plus accumulated provision for loan losses and
other exposures. The TRR is the minimum capital required to cover expected and unexpected losses, (under a stressed
but still plausible downside scenario), in connection with all of IDA’s currently existing operations and assets. Within
the TRR there is also a capital allowance to reflect losses that result from valuing IDA’s concessional loan portfolio
in present value terms using market interest rates. This allowance is calculated using a stressed interest rate to account
Types of Financial Risk
How the risk is managed
Credit Risk
Country Credit Risk
Counterparty Credit Risk
credit-risk-bearing capacity and individual country exposure limits.
Counterparty credit limits and collateral.
Market Risk
Interest Rate Risk
Exchange Rate Risk
Liquidity Risk
Interest rate derivatives to match the sensitivity of assets and liabilities.
Currency derivatives to match the currency composition of assets and liabilities.
Prudential minimum liquidity level.
Operational Risk
Risk assessment and monitoring of key risk indicators and internal and external
operational risk events.

Section IX: Risk Management
June 30, 2022 41
for a potential future rise in market interest rates. In addition, TRR includes capital requirements to account for
development grants which are approved but not yet expensed. It also takes into consideration the capital adequacy
protection provided by long-term fixed rate borrowings against changes in market interest rates. The CB is an extra
buffer in the amount of 10 percent of TRA.
As of June 30, 2022, the DSC was 26.4%, lower by 4.0 percentage points compared with June 30, 2021 (30.4%). The
decrease in ratio is mainly due to a higher TRR. The increase in TRR was primarily due to higher capital requirements
for conditional development grants approved but not yet expensed. IDA’s capital continues to be adequate to support
its operations. See Table 27.
Table 27: Deployable Strategic Capital Ratio
In billions of U.S. dollars except ratios in percentages
As of June 30,
2022
2021
Variance
Total Resources Available (TRA)
$
183.5
$
185.7
$
(2.2)
Total Resources Required (TRR)
116.7
110.6
6.1
Conservation Buffer (CB)
18.4
18.6
(0.2)
Deployable Strategic Capital (DSC = TRA-TRR-CB)
$
48.4
$
56.5
$
(8.1)
Deployable Strategic Capital as a percentage of TRA
26.4%
30.4%
(4.0%)
Asset/Liability Management
On July 1, 2021, IDA implemented an interim ALM policy which, under specific criteria, allows funding fixed rate
loans with long-term fixed rate market debt and CPL (both reported at amortized cost), as part of IDA’s interest rate
risk management to match debt characteristics with that of the loan portfolio. For more details, see Notes to the
Financial Statements for the year ended June 30, 2022, Note E - Borrowings.
Capital Value Protection Program
In FY20, as part of IDA’s ALM policies, IDA executed pay fixed, receive floating forward-starting swaps with a
notional of $15.0 billion under a Board-approved Capital Value Protection Program. The objective of the program is
to partially reduce the sensitivity of IDA’s capital adequacy model to changes in long-term interest rates and allow for
more resources to be available for lending under the capital adequacy framework.
Changes in the values of these forward-starting swaps partially offset changes in the present value of loans, thereby
reducing the sensitivity of IDA’s capital adequacy to long-term interest rate movements and providing greater stability
in IDA’s long-term financing to clients. These swaps are included in the ALM portfolio. For more details, see Notes
to the Financial Statements for the year ended June 30, 2022, Note F - Derivative Instruments.
Asset Coverage Principles
In addition to the DSC framework, IDA has policies in place to ensure alignment of its lending and borrowing
activities. Specifically, the Board approved the following asset coverage principles:
• Management will monitor the level of assets available to satisfy all of IDA’s borrowings and shall adjust future
lending and grant commitments should the level of asset coverage fall below the level expected for a triple-A
rated entity.
• Management will monitor IDA’s liquidity to ensure its ability to satisfy its borrowing and commitment
obligations even under stressed conditions taking into account the level expected for a triple-A rated entity
without callable capital.
• If IDA’s access to the capital markets or alternative sources of cash funding is impaired, then no additional loan
or grant commitments will be approved until access to cash funding has resumed or all market debt is repaid.
Credit Risk
IDA faces two types of credit risk: country credit risk and counterparty credit risk. Country credit risk is the risk of
loss due to a country not meeting its contractual obligations, and counterparty credit risk is the risk of loss attributable
to a counterparty not honoring its contractual obligations. IDA is exposed to commercial as well as noncommercial
counterparty credit risk.
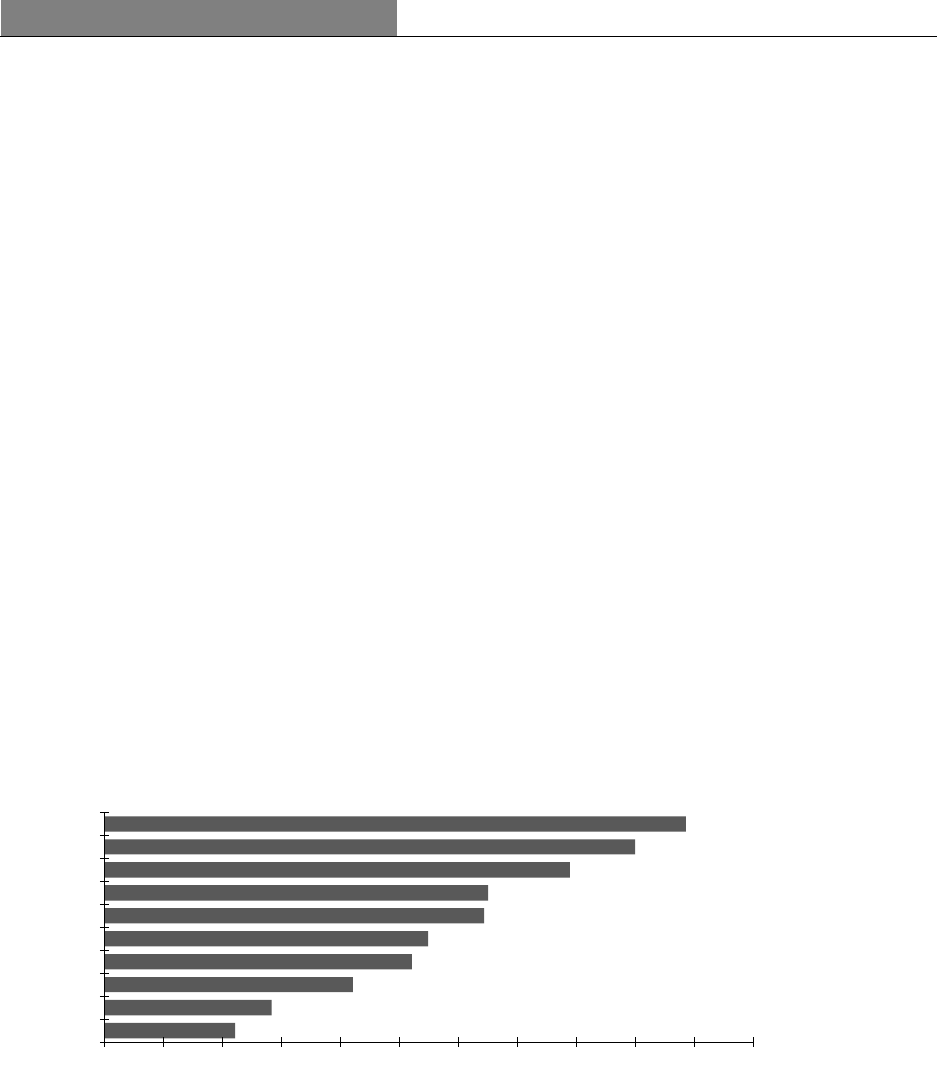
Section IX: Risk Management
42 June 30, 2022
Country Credit Risk
IDA’s lending management framework encompasses the long-standing PBA mechanism and allocation framework
agreed at each replenishment, complemented by additional considerations required when accessing debt markets to
ensure adherence to risk management (capital adequacy) requirements.
While the PBA framework was not originally intended as a credit quality metric, it incorporates factors related to
country credit risk. The PBA determines the volume of concessional IDA resources allocated to each country, based
on performance in implementing policies that promote economic growth and poverty reduction, as assessed under the
Country Policy and Institutional Assessment (CPIA). The CPIA includes economic management criteria, such as fiscal
policy and debt policy and management.
In addition to these considerations in the PBA, IDA assesses the country credit risk of all its borrowers. IDA produces
credit risk ratings for all its borrowing countries, which reflect country economic, financial, and political
circumstances, and also considers environmental, social and governance (ESG) risk factors. Based on these risk
ratings, to manage overall portfolio risk, the allocation outcomes of the PBA and other mechanisms are reviewed to
ensure that they are compatible with the Deployable Strategic Capital Framework and Single Borrower Limit.
Single Borrower Limit
Portfolio concentration risk, which arises when a small group of borrowing countries account for a large share of loans
outstanding, is a key consideration for IDA. Concentration risk is managed through the SBL, which caps exposure to
any single borrowing country at 25 percent of equity, in line with the Basel-based maximum exposure limit.
For FY23, the SBL has been set at $45 billion (25 percent of $178.7 billion of equity as of June 30, 2022), largely
unchanged compared to FY22. Currently, the maximum country exposure levels compatible with IDA’s overall capital
adequacy target are lower than the SBL for all IDA-borrowing countries. As a consequence, the SBL is not currently
a constraining factor.
As of June 30, 2022, the ten countries with the highest exposures accounted for 66% of IDA’s total exposure (Figure
16). Monitoring these exposures relative to the SBL requires consideration of the repayment profiles of existing loans,
as well as disbursement profiles and projected new loans and guarantees.
Figure 16: Country Exposures as of June 30, 2022
In billions of U.S. dollars
Debt Relief
IDA has participated in two comprehensive debt relief initiatives, HIPC and MDRI, adopted by the global
development community to reduce the debt burdens of developing countries. In each case, IDA agreed to provide debt
relief in return for future compensation from members for forgone reflows, ensuring that IDA’s financial capacity
would not be reduced. For a borrower to be eligible for debt relief on its loans with IDA, it is required to maintain
macroeconomic stability, carry out key structural and social reforms, and maintain all loans in accrual status.
Expected Losses, Overdue Payments and Non-Performing Loans
When a borrower fails to make payments on any principal, interest, or other charges due to IDA, IDA may suspend
disbursements immediately on all loans and grants to that borrower. IDA’s current practice is to exercise this option
using a gradual approach (Table 28). These practices also apply to member countries eligible to borrow from both
IDA and IBRD, and whose payments on IBRD loans may become overdue. It is IDA’s practice not to reschedule
4.4
5.7
8.4
10.4
11.0
12.9
13.0
15.8
18.0
19.7
0 2 4 6 8 10 12 14 16 18 20 22
Uganda
Ghana
Tanzania
Kenya
Ethiopia
Vietnam
Nigeria
Pakistan
Bangladesh
India
Top Ten Country Exposures

Section IX: Risk Management
June 30, 2022 43
service charges, interest or principal payments on its loans or participate in debt rescheduling agreements with respect
to its loans. As of June 30, 2022, two of the IDA borrowing countries in the accrual portfolio had overdue payments
beyond 45 days.
Table 28: Treatment of Overdue Payments
Overdue by 30 days
Where the borrower is the member country, no new loans, or grants to the member country, or to any other
borrower in the country, will be presented to the Board for approval nor will any previously approved loans or
grants be signed, until payments for all amounts 30 days overdue or longer have been received. Where the
borrower is not the member country, no new loans or grants to that borrower will be signed or approved.
Overdue by 45 days
In addition to the provisions cited above for payments overdue by 30 days, to avoid proceeding further on the
notification process leading to suspension of disbursements, the country as borrower or guarantor and all
borrowers in the country must pay not only all payments overdue by 30 days or more, but also all payments
due regardless of the number of days since they have fallen due. Where the borrower is not the member
country, no new loans, or grants to, or guaranteed by, the member country, will be signed or approved.
Overdue by 60 days
In addition to the suspension of approval for new loans or grants and signing of previously approved loans or
grants, disbursements on all grants or loans to or guaranteed by the member country are suspended until all
overdue amounts are paid. This policy applies even when the borrower is not the member country. Under
Overdue by more
than six months
All loans made to or guaranteed by a member of IDA are placed in nonaccrual status, unless IDA determines
that the overdue amount will be collected in the immediate future. Unpaid service charges and other charges
not yet paid on loans outstanding are deducted from the income for the current period. To the extent that
these payments are received, they are included in income. At the time of arrears clearance, if collectability
ically emerge from
nonaccrual status. In such instances, a decision is made on the restoration of accrual status on a case-by-
case basis and in certain cases, this decision may be deferred until after a suitable period of payment
performance has passed.
As an exception to the practices set forth in Table 28, IDA has provided financing to countries with overdue payments,
in very specific situations:
• IDA has provided grants from its Crisis Response Window to third party agencies for use in Somalia and
Zimbabwe in response to major crises, during FY17 and FY19 respectively, and;
• IDA has financed a few regional projects, for the benefit of countries with overdue payments to IDA, through its
Regional Program Window.
In the past, on an exceptional basis, IDA financed through concessional loans and grants the following regional
projects, where participation of a country with overdue payments was crucial to the success of the regional project.
• In April 2017, the Kenya Displacement project ($103 million) through Intergovernmental Authority on
Development (IGAD) that included financing for Somalia, a country with overdue payments at the time.
• In December 2014, Kariba Dam Rehabilitation Project ($75 million) that included benefits for Zimbabwe, a
country with overdue payments.
• In September 2003, West Africa HIV/AIDS project for the Abidjan-Lagos Transport Corridor ($17 million) that
included benefits for Togo, a country with overdue payments at that time.
In the above cases, financing was not made directly to the country with overdue payments. Implementation
arrangements were such that a regional bank or another participating country took on the obligation of the regional
project on behalf of the country with overdue payments to IDA.
In addition, IDA may engage with countries with overdue payments when a very narrow and well-defined set of
criteria are met, including a clear path to arrears clearance. For more details on exceptional financing, see Section III:
IDA’s Financial Resources.
Accumulated Provision for Losses on Loans and other Exposures
The total exposure for provisioning is the current exposure and the estimated exposure taking into account expected
disbursements and repayments over the life of the instruments. The expected credit losses related to loans and other
exposures are calculated over the life of the instruments based on the expected exposures, the expected default
frequency (probability of default to IDA) and the estimated loss given default. The provision for expected losses is
the sum of the expected annual losses over the life of the instruments. A key determinant in the provision for losses
on loans and other exposures is IDA’s borrowing country credit risk ratings. These ratings are IDA’s own assessment
of borrowers’ ability and willingness to repay IDA on time and in full.

Section IX: Risk Management
44 June 30, 2022
As of June 30, 2022, IDA had $178.1 billion of loans outstanding, of which loans in nonaccrual status represent 0.5%.
IDA’s total provision for losses on loans and other exposures was $4.8 billion, which represents a provisioning rate
of 1.9% of the underlying exposures ($4.9 billion as of June 30, 2021, 2.0% of the underlying exposures). For a
summary of countries with loans or guarantees in nonaccrual status as of June 30, 2022, see Notes to the Financial
Statements for the year ended June 30, 2022, Note D–Loans and Other Exposures.
Commercial Counterparty Credit Risk
Commercial counterparty credit risk is the risk that counterparties fail to meet their payment obligations under the
terms of the contract or other financial instruments. Effective management of counterparty credit risk is vital to the
success of IDA’s funding, investment, and asset/liability management activities. The monitoring and management of
these risks is continuous as the market environment evolves.
IDA mitigates the counterparty credit risk from its investment and derivative holdings through the credit approval
process, the use of collateral agreements and risk limits, and other monitoring procedures. The credit approval process
involves evaluating counterparty and product specific creditworthiness, assigning internal credit ratings and limits,
and determining the risk profile of specific transactions. Credit limits are set and monitored throughout the year.
Counterparty exposure is updated daily, taking into account current market values of assets held, estimates of potential
future movements of exposure for derivative instruments, and related counterparty collateral agreements. Collateral
posting requirements are based on thresholds driven by public credit ratings. Collateral held includes cash and highly
rated liquid investment securities. Commercial credit risk management includes ESG related assessments in the
approval and monitoring of higher exposure counterparties for the liquid asset portfolio and for derivative
counterparties.
IDA’s liquid asset portfolio consists mostly of sovereign government bonds, debt instruments issued by sovereign
government agencies, and time deposits with banks. 74% of these investments are with issuers and counterparties
rated triple-A or double-A (Table 30).
Derivative Instruments
In the normal course of its business, IDA enters into various derivative instruments to manage foreign exchange and
interest rate risks. These instruments are also used to help borrowers to manage their financial risks. Derivative
transactions are conducted with other financial institutions and, by their nature, entail commercial counterparty credit
risk.
While the volume of derivative activity can be measured by the contracted notional value of derivatives, notional
value is not an accurate measure of credit or market risk. IDA uses the estimated replacement cost of the derivative
instruments, or potential future exposure (PFE), to measure credit risk with counterparties.
Under IDA’s mark-to-market collateral arrangements, IDA receives collateral when mark-to-market exposure is
greater than the ratings-based collateral threshold. As of June 30, 2022, IDA received $772 million of cash collateral
for its derivative transactions (Nil - June 30, 2021).
IDA is not required to post collateral under its derivative agreements as long as it maintains a triple-A credit rating.
(For the contractual value, notional amounts, related credit risk exposure amounts, and the amount IDA would be
required to post in the event of a downgrade, see Notes to the Financial Statements for the year ended June 30, 2022,
Note F–Derivative Instruments).
Investment Securities
IDA’s Board-approved General Investment Authorization provides the basic authority for IDA to invest its liquid
assets. Furthermore, all investment activities are conducted in accordance with a more detailed set of Investment
Guidelines set by management. The investment guidelines are approved by the MDCFO and implemented by the
Treasurer. The most recent update was in FY18, to incorporate the changes required under the IDA18 hybrid financing
model. Issuer and product investment eligibility and risk parameters relative to benchmarks are core components of
these Guidelines. The Guidelines also include a consultative loss limit to reflect a level of tolerance for the risk of
underperforming the benchmark in any fiscal year and a duration deviation metric. Clear lines of responsibility for
risk monitoring and compliance are highlighted in the Guidelines. Credit risk appetite is conveyed through specific
eligibility criteria (Table 29). IDA has procedures in place to monitor performance against this limit and potential
risks, and it takes appropriate actions if the limit is reached. All investments are subject to additional conditions
specified by the market and counterparty risk department, as deemed necessary.
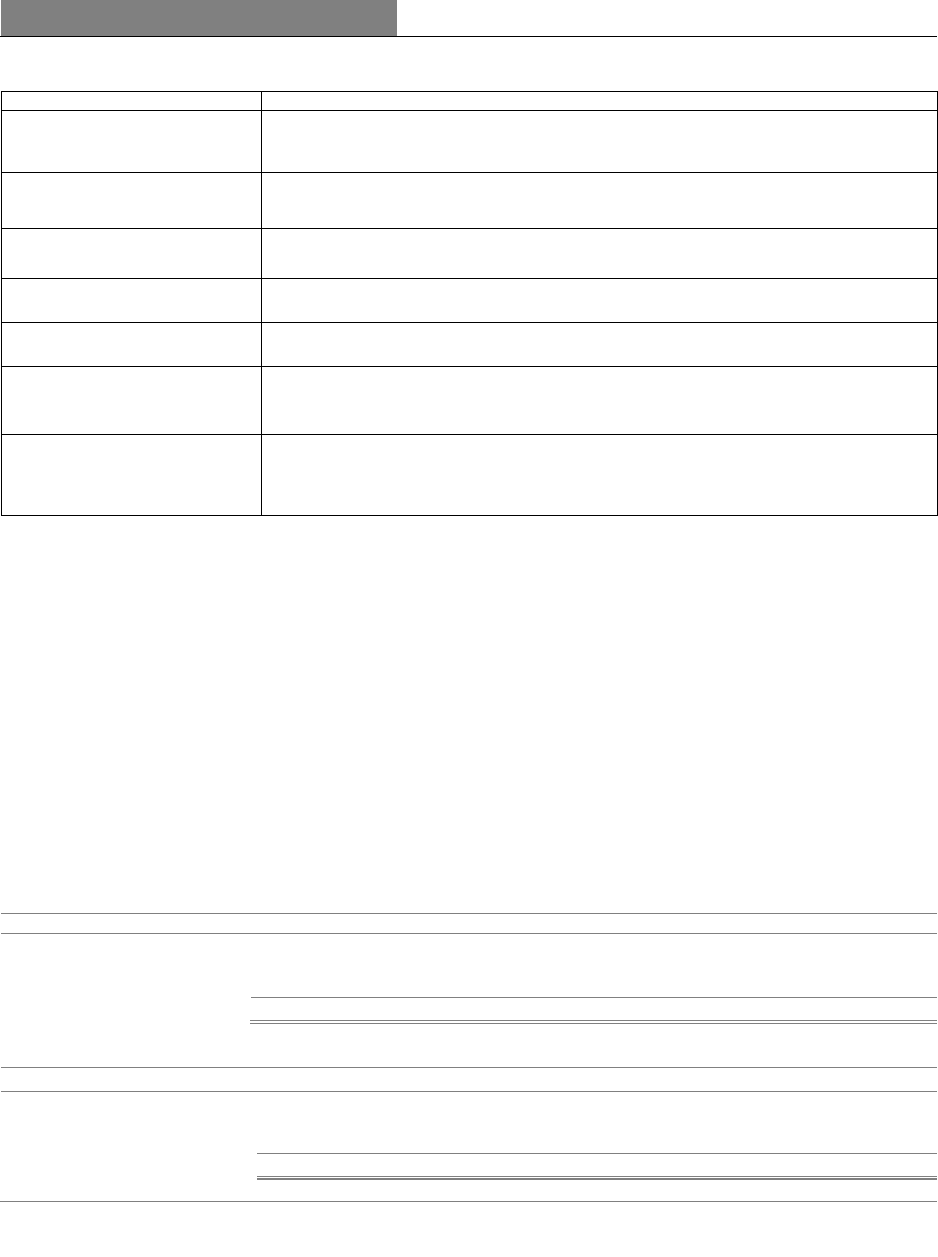
Section IX: Risk Management
June 30, 2022 45
Table 29s
Eligible Investments
a
Description
Sovereigns
IDA may only invest in obligations issued or unconditionally guaranteed by governments of
member countries with a minimum credit rating of AA-. However, no rating is required if
government obligations are denominated in the national currency of the issuer.
Agencies
IDA may invest only in obligations issued by an agency or instrumentality of a government of a
member country, a multilateral organization, or any other official entity other than the government
of a member country, with a minimum credit rating of AA-.
Corporates and asset-backed
securities
IDA may only invest in securities with a triple-A credit rating.
Time deposits
b
IDA may only invest in time deposits issued or guaranteed by financial institutions, whose senior
debt securities are rated at least A-.
Commercial paper
IDA may only invest in short-term borrowings (less than 190 days) from commercial banks,
corporates, and financial institutions with at least two Prime-1 ratings.
Securities lending, and borrowing,
repurchases, resales, and reverse
repurchases
IDA may engage in securities lending, against adequate collateral repurchases and reverse
repurchases, against adequate margin protection, of the securities described under the
sovereigns, agencies, and corporates and asset-backed security categories.
Collateral assets
IDA may engage in collateralized forward transactions, such as swap, repurchase, resale,
securities lending, or equivalent transactions that involve certain underlying assets not
independently eligible for investment. In each case, adequate margin protection needs to be
received.
a. All investments are subject to approval by the Market and Counterparty Risk department and must appear on the “Approved List”
created by the department.
b. Time deposits include certificates of deposit, bankers’ acceptances and other obligations issued or unconditionally guaranteed by
banks or other financial institutions.
The credit quality of IDA’s investment portfolio remains in the upper end of the credit spectrum with 74% of the
portfolio rated AA or above as of June 30, 2022, reflecting IDA’s continued preference for highly-rated securities and
counterparties across all categories of financial instruments. Total commercial counterparty credit exposure, net of
collateral held, was $40,376 million as of June 30, 2022.
Commercial Counterparty Credit Risk Exposure
As a result of IDA’s use of mark-to-market collateral arrangements for swap transactions, its residual commercial
counterparty credit risk exposure is concentrated in the investment portfolio, in instruments issued by sovereign
governments and non-sovereign holdings (including agencies, asset backed securities, corporates, and time deposits).
(See Table 30).
Table 30: Commercial Credit Exposure, Net of Collateral Held, by Counterparty Rating
In millions of U.S. dollars, except rates in percentages
As of June 30, 2022
Counterparty Rating
a
Sovereigns
Non-Sovereigns
Net Swap Exposure
Total Exposure
% of Total
AAA
$
10,567
$
5,038
$
-
$
15,605
39
%
AA
2,226
11,949
155
14,330
35
A
4,256
5,901
284
10,441
26
Total
$
17,049
$
22,888
$
439
$
40,376
100
%
As of June 30, 2021
Counterparty Rating
a
Sovereigns
Non-Sovereigns
Net Swap Exposure
Total Exposure
% of Total
AAA
$
9,345
$
6,023
$
-
$
15,368
41
%
AA
2,519
7,438
179
10,136
27
A
7,571
4,378
68
12,017
32
Total
$
19,435
$
17,839
$
247
$
37,521
100
%
a. Average rating is calculated using available ratings from the three major rating agencies; however, if ratings are not available
from each of the three rating agencies, IDA uses the average of the ratings available from any of such rating agencies or a
single rating to the extent that an instrument or issuer (as applicable) is rated by only one rating agency.
For the contractual value, notional amounts and related credit risk exposure amounts by instrument see Notes to the
Financial Statements for the year ended June 30, 2022, Note F - Derivative Instruments.
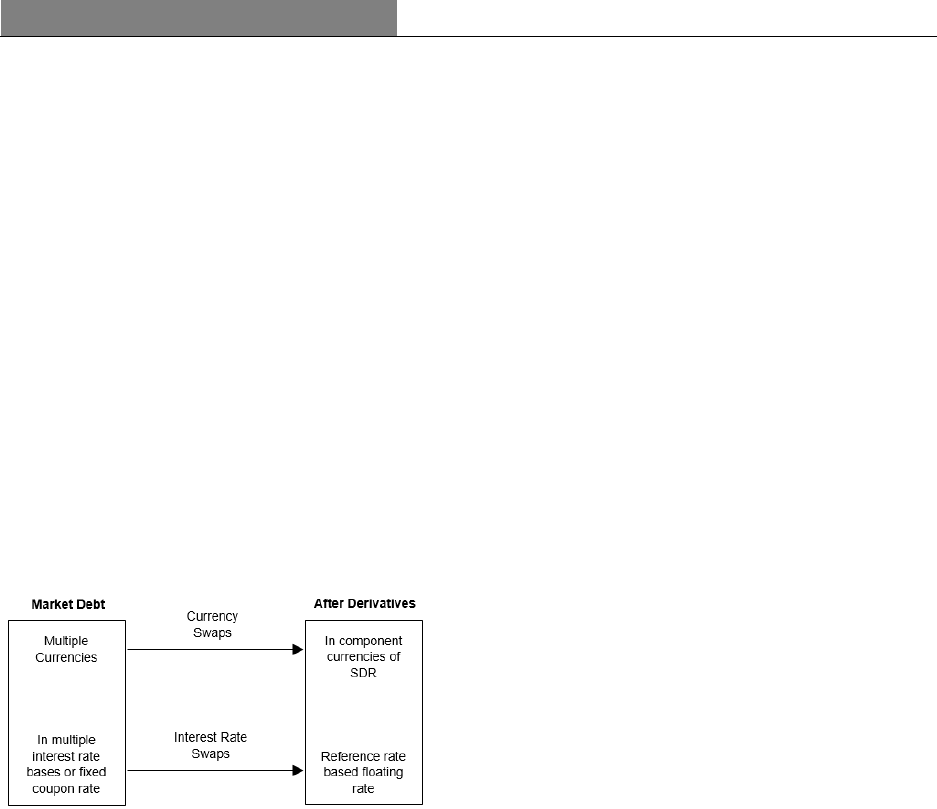
Section IX: Risk Management
46 June 30, 2022
Credit and Debit Valuation Adjustments
Most outstanding derivative positions are transacted over-the-counter and therefore valued using internally developed
valuation models. For commercial and non-commercial counterparties where IDA has a net exposure (net receivable
position), IDA calculates a Credit Valuation Adjustment (CVA) to reflect credit risk. For net derivative positions with
commercial and non-commercial counterparties where IDA is in a net payable position, IDA calculates a Debit
Valuation Adjustment (DVA) to reflect its own credit risk.
The CVA is calculated using the fair value of the derivative contracts, net of collateral received under credit support
agreements, and the probability of counterparty default based on the Credit Default Swaps (CDS) spread and, where
applicable, proxy CDS spreads. IDA does not currently hedge this exposure. The DVA calculation is generally
consistent with the CVA methodology and incorporates IDA’s own credit spread as observed through the CDS market.
As of June 30, 2022, IDA recorded a CVA on its balance sheet of $35 million, and a DVA of $19 million.
Market Risk
IDA is exposed to changes in interest and exchange rates. The introduction of market debt financing into IDA’s
business model from FY18 presents additional exposures.
IDA uses derivatives to manage its exposure to various market risks. Derivatives are used to align the interest and
currency composition of its assets (loan and investment trading portfolios) with that of its liabilities (borrowing
portfolio) and equity, with the exception of the long-term fixed rate market debt that is used to fund fixed rate loans.
Figure 17 below illustrates the use of derivatives for market borrowing portfolios. Loan, investment and borrowing
portfolios are largely maintained in SDR and its component currencies.
Figure 17: Use of Derivatives for Market Borrowings
Interest Rate Risk
IDA is exposed to interest rate risk due to mismatches between its assets (loan and investment portfolios) and its
liabilities (borrowing portfolio) both in terms of maturity and instrument type. Despite the rising interest rate, low and
negative fixed interest rates remain a challenge for the investment of the liquid asset portfolio. Given IDA’s lengthy
disbursement profile, the duration of IDA’s loans is relatively long (12 years). As of June 30, 2022, IDA’s investment-
trading portfolio (liquid asset portfolio) had a duration of four months.
Under its integrated financing model, IDA employs the following strategies to manage interest rate risk:
• The capital adequacy policies factor in the sensitivity to interest rates.
• Matching interest rates between assets and related funding to minimize open interest rate positions.
• The funding risk related to the mismatch between the maturity profile of the debt funding and the related assets is
monitored through duration measurements and adjustments to capital requirements to cover this risk.
Alternative Reference Rate
In July 2017, the Financial Conduct Authority (FCA), the regulator of the London Interbank Offered Rate (LIBOR),
announced that it would no longer compel panel banks to submit rates required to calculate LIBOR after December
31, 2021, and therefore, market participants, including IDA and its borrowers, needed to move to alternative reference
rates.

Section IX: Risk Management
June 30, 2022 47
In March 2021, the FCA confirmed that all LIBOR settings will either cease to be provided by any administrator or
will no longer be representative, as follows:
Type of LIBOR
Setting
Date of cessation
GBP LIBOR
All settings
December 31, 2021
EUR LIBOR
CHF LIBOR
JPY LIBOR
USD LIBOR
1-week, 2-month
USD LIBOR
Remaining settings, including 6-month
June 30, 2023
In consideration of the regulatory guidance and in preparation for the global markets’ transition away from LIBOR,
IDA took the necessary steps to facilitate a smooth and orderly transition of its financial instruments affected by
alternative reference rates.
Most of IDA’s loans are on fixed rate concessional terms. Therefore, the impact of the LIBOR transition on IDA loans
is limited. For IDA’s LIBOR based non-concessional and hard-term loans, in FY20, the Board endorsed an omnibus
amendment and notification process with borrowers for certain existing loan agreements to address inadequate
fallback provisions for LIBOR replacement, allowing IDA to maintain the principles of fairness and equivalence for
any replacement reference rate. IDA’s non-concessional loans were denominated in USD, EUR, GBP, and JPY as of
December 31, 2021. IDA adopted the following alternative reference rates: Secured Overnight Financing Rate (SOFR)
for USD denominated loans, Euro Interbank Offered Rate (EURIBOR) for EUR denominated loans, Sterling
Overnight Index Average (SONIA) for GBP denominated loans and Tokyo Overnight Average Rate (TONA) for JPY
denominated loans. Through these processes, the vast majority of its borrowers’ loans were ready for transition by
December 31, 2021.
Effective January 1, 2022, IDA offers new non-concessional loans with alternative reference rates and ceased to offer
LIBOR based loans. The switchover of existing variable spread and non-USD fixed spread loans to alternative
reference rates began in January 2022, at the loan reset dates. The remaining USD fixed spread loans will be
transitioning beginning in July 2023, as the loans reset. Out of the total loans outstanding of $178,091 million as of
June 30, 2022, approximately 0.5% have transitioned and 1.4% are still subject to transition to alternative reference
rates. The remaining 98.1% are not subject to transition to alternative reference rates as they are on fixed-rate terms.
As of June 30, 2022, IDA’s borrowing portfolio before associated derivatives carries only fixed interest rates and is
not subject to transition to alternative reference rates.
Out of the total derivative portfolio notional as of June 30, 2022, approximately 5% have transitioned and 35% are
subject to transition to alternative reference rates. The remaining 60% of the total derivative portfolio notional are not
subject to transition to alternative reference rates. For the vast majority of the derivative portfolio subject to transition,
IDA either has sufficient provisions in the derivative agreements with its counterparties or has adhered to the
International Swaps and Derivatives Association (ISDA) 2020 IBOR Fallbacks Protocol (IBOR Protocol) or works
bilaterally with counterparties to ensure smooth transition to alternative reference rates.
IDA will continue to work with key stakeholders, including internal subject matter experts, senior management,
borrowers, industry groups and other market participants, to mitigate potential financial and operational risks to which
IDA is exposed and to ensure an orderly transition to alternative reference rates.
Exchange Rate Risk
IDA faces foreign exchange rate risk as a result of the currency mismatch between its commitments for loans and
grants, which are mainly denominated in SDRs; equity contributions from members, which are typically denominated
in national currencies; and the portion of IDA’s internal resources and expenditures that are denominated in U.S.
dollars.
Changes in exchange rates affect the capital adequacy of IDA when the currency of the equity supporting the loan
portfolio and other assets is different from that of the risk exposure. Accordingly, the primary objective of IDA’s
currency risk management is to protect IDA’s financial capacity, as measured by the capital adequacy framework,
from exchange rate movements.

Section IX: Risk Management
48 June 30, 2022
To achieve this, IDA’s balance sheet is managed in multiple currencies: SDR and the currencies comprising the SDR
basket. The exchange rate risk management methodology includes the hedging of: (i) currency risk arising from
settlement of loan disbursements, loan repayments and donor contributions; (ii) debt funding; (iii) IDA loans; (iv)
donor contributions; and (v) administrative budget.
The reported levels of its assets, liabilities, income, and expenses in the financial statements are affected by exchange
rate movements in all the currencies in which IDA transacts, relative to its reporting currency, the U.S. dollar. These
movements are shown as currency translation adjustments. Translation adjustments relating to the revaluation of assets
and liabilities denominated in SDR and SDR component currencies (IDA’s functional currencies), are reflected in
Accumulated Other Comprehensive Income (Loss), in equity. Translation adjustments relating to non-functional
currencies are reported in IDA’s Statement of Income (see Notes to the Financial Statements for the year ended June
30, 2022, Note A – Summary of Significant Accounting and Related Policies).
IDA uses currency forward contracts to convert future inflows from members’ receivables provided in national
currencies into the five currencies of the SDR basket, thereby aligning the currency composition of member
contributions with the net cash outflows relating to loans and grants, which are primarily denominated in SDR.
Liquidity Risk
Liquidity risk arises in the general funding of IDA’s activities and in managing its financial position. It includes the
risk of IDA being unable to fund its portfolio of assets at appropriate maturities and rates, and the risk of being unable
to liquidate a position in a timely manner at a reasonable price.
IDA’s aggregate liquid asset holdings are kept above a specified prudential minimum to safeguard against cash flow
interruptions. The Prudential Minimum is equal to 80% of 24 months of projected net outflows. For FY22, the
prudential minimum was $19.3 billion. For FY23, the prudential minimum has been set at $20.8 billion. As of June
30, 2022, IDA’s liquid assets were $39.2 billion, 203% of the FY22 prudential minimum.
IDA will hold liquidity above the prudential minimum to ensure sufficient liquidity under a wide range of shock
scenarios as well as to give it flexibility in timing its borrowing transactions and to meet working capital needs.
Operational Risk
Operational risk is defined as the risk of financial loss, or damage to IDA’s reputation resulting from inadequate or
failed internal processes, people, and systems, or from external events.
IDA recognizes the importance of operational risk management activities, which are embedded in its financial
operations. As part of its business activities, IDA is exposed to a range of operational risks including physical security
and staff health and safety, data and cyber security, business continuity, and third-party vendor risks. IDA’s approach
to identifying and managing operational risk includes a dedicated program for these risks and a robust process that
includes identifying, assessing, and prioritizing operational risks, monitoring, and reporting relevant key risk
indicators, aggregating, and analyzing internal and external events, and identifying emerging risks that may affect
business units and developing risk response and mitigating actions.
Cybersecurity Risk Management
IDA’s operations rely on the secure processing, storage, and transmission of confidential and other information in
computer systems and networks. As is the case for financial institutions generally, cybersecurity risk continues to be
significant for IDA due to the evolving sophistication and complexity of the cyber threat landscape. These risks are
unavoidable, and IDA seeks to manage them on a cost-effective basis consistent with its risk appetite.
To protect the security of its computer systems, software, networks and other technology assets, IDA has developed
its cybersecurity risk management program, consisting of cybersecurity policies, procedures, compliance, and
awareness programs. IDA deploys a multi-layered approach for cybersecurity risk management to help prevent and
detect malicious activity, both from within the organization and from external sources. In managing emerging cyber
threats such as malware including ransomware, denial of service and phishing attacks, IDA strives to adapt its
technical and process-level controls and raise the level of user awareness to mitigate the risk.
IDA periodically assesses the maturity and effectiveness of its cyber defenses, through risk mitigation techniques,
including but not limited to, targeted testing, internal and external audits, incident response desktop exercises and
industry benchmarking.

Section X: Critical Accounting Policies and the Use of Estimates
June 30, 2022 49
Section X: Critical Accounting Policies and the Use of Estimates
IDA’s significant accounting policies, as well as estimates made by management, are integral to its financial reporting.
While all of these policies require a certain level of judgment and estimates, significant policies require management
to make highly difficult, complex, and subjective judgments as these relate to matters inherently uncertain and
susceptible to change. Note A to the financial statements contains a summary of IDA’s significant accounting policies
including a discussion of recently issued accounting pronouncements.
Fair Value of Financial Instruments
All fair value adjustments are recognized through the Statement of Income, except for changes in the fair value of
debt related to IDA’s own credit, which are reported in Other Comprehensive Income. The fair values of financial
instruments are based on a three-level hierarchy.
For financial instruments classified as Level 1 or 2, less judgment is applied in arriving at fair value measures as the
inputs are based on observable market data. For financial instruments classified as Level 3, unobservable inputs are
used. These require management to make important assumptions and judgments in determining fair value measures.
Derivative contracts include currency forward contracts, to-be-announced (TBA) securities, swaptions, exchange
traded options and futures contracts, currency swaps, and interest rate swaps. Plain vanilla swaps and structured swaps
are valued using the standard discounted cash flow methods using observable market inputs such as yield curves,
foreign exchange rates and basis spreads.
In instances where management relies on instrument valuations supplied by external pricing vendors, there are
procedures in place to validate the appropriateness of the models used as well as the inputs applied in determining
those values.
The majority of IDA’s financial instruments which are recorded at fair value are classified as Level 1 and Level 2 as
of June 30, 2022, as the inputs are based on observable market data and less judgment is applied in arriving at fair
value measures.
On a quarterly basis, the methodology, inputs, and assumptions are reviewed to assess the appropriateness of the fair
value hierarchy classification of each financial instrument. All the financial models used for input to IDA’s financial
statements are subject to both internal and periodic external verification and review by qualified personnel.
Provision for Losses on Loans and Other Exposures
IDA’s accumulated provision for losses on loans and other exposures reflects the expected losses inherent in its
nonaccrual and accrual portfolios after taking into consideration the expected relief under the HIPC Debt Initiative
and MDRI and any provision for losses on the buy-down of loans.
Adjustments to the accumulated provision are recorded as a charge to or a release of provision in the Statement of
Income. Actual losses may differ from expected losses due to unforeseen changes in any of the factors that affect
borrowers’ creditworthiness.
The Credit Risk Committee monitors aspects of country credit risk, in particular, reviewing the provision for losses
on loans and guarantees taking into account, among other factors, any changes in exposure, risk ratings of borrowing
member countries, or movements between the accrual and nonaccrual portfolios.
Additional information on IDA’s provisioning policy and the status of nonaccrual loans can be found in the Notes to
Financial Statements for the year ended June 30, 2022, Note A-Summary of Significant Accounting and Related
Policies and Note D- Loans and Other Exposures.
Provision for HIPC Debt Initiative and MDRI
IDA records a provision for all the estimated expected write-offs of loans outstanding for debt relief to be delivered
under the HIPC Debt Initiative and MDRI. Donors have agreed to compensate IDA through member contributions for
the foregone loan reflows under the HIPC Debt Initiative and MDRI.
The adequacy of the accumulated provision for the HIPC Debt Initiative and MDRI is based on both quantitative and
qualitative analyses of various factors, including estimates of Decision and Completion Point dates of eligible
countries. IDA periodically reviews these factors and reassesses the adequacy of the accumulated provision for the
HIPC Debt Initiative and MDRI. Adjustments to the accumulated provision are recorded as a charge to or release of
provision in the Statement of income.
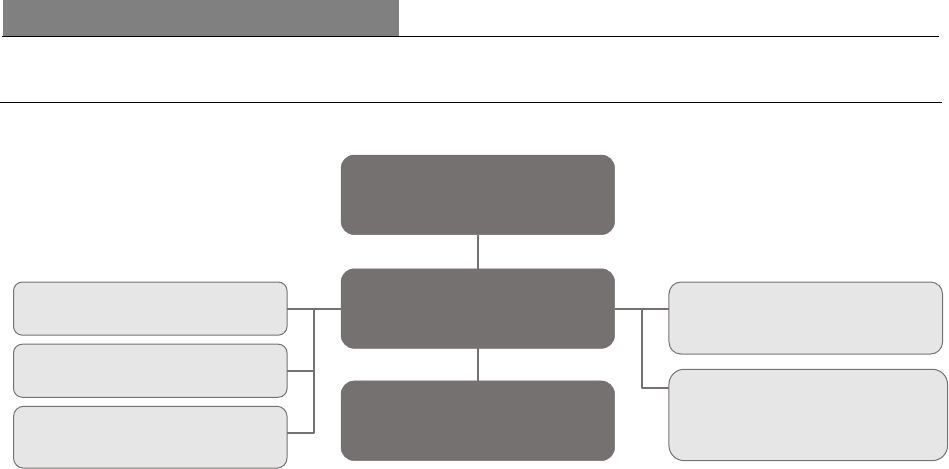
Section XI: Governance and Internal Controls
50 June 30, 2022
Section XI: Governance and Internal Controls
Figure 18: Governance Structure
Business Conduct
The WBG promotes a positive work environment in which staff members understand their ethical obligations to the
institution. In support of this commitment, the institution has a Code of Conduct in place. The WBG has both an Ethics
Helpline and a Fraud and Corruption hotline. A third-party service offers many methods of worldwide communication.
Reporting channels include telephone, mail, email, or confidential submission through a website.
IDA has in place procedures for receiving, retaining, and handling recommendations and concerns relating to business
conduct identified during the accounting, internal control, and auditing processes.
WBG staff rules clarify and codify the staff’s obligations in reporting suspected fraud, corruption, or other misconduct
that may threaten the operations or governance of the WBG. These rules also offer protection from retaliation.
General Governance
IDA’s decision-making structure consists of the Board of Governors, the Executive Directors, the President,
management, and staff. The Board of Governors is the highest decision-making authority. Governors are appointed
by their member governments for a five-year term, which is renewable. The Board of Governors may delegate
authority to the Executive Directors (referred to as the Board in this document) to exercise any of its powers, except
for certain powers enumerated in the IDA Articles. IDA has its own policies and frameworks that are carried out by
staff that share responsibilities for both IDA and IBRD.
In addition, IBRD and IDA have joint internal institutional oversight units which play an assurance role to shareholders
and management that IDA’s work is impactful and accountable, informed by best practices, and delivered to the
highest ethical standards with risk management controls and governance processes that are functioning
effectively. Expenses for these oversight units, including the Executive Directors, were $116.6 million in FY22 (and
$111.7 million FY21) shared between IBRD and IDA.
Executive Directors
In accordance with the Articles, Executive Directors are appointed or elected every two years by their member
governments. The Board currently has 25 Executive Directors who represent all 174 member countries. Executive
Directors are neither officers nor staff of IDA. The President is the only member of the Board from management, and
he serves as a non-voting member and as Chairman of the Board.
The Board is required to consider proposals made by the President on IDA loans, grants, and guarantees and on other
policies that affect its general operations. The Board is also responsible for presenting to the Board of Governors, at
the Annual Meetings, audited accounts, an administrative budget, and an annual report on operations and policies and
other matters.
The Board and its committees are in sessions as business requires. Each committee's terms of reference establish its
respective roles and responsibilities. As committees do not vote on issues, their role is primarily to serve the Board in
discharging its responsibilities.
Executive
Directors
Board of Governors
President
Audit Committee
Budget Committee
Human Resources
Committee
Committee on Governance
Administrative Matters
Committee on Development
Effectiveness

Section XI: Governance and Internal Controls
June 30, 2022 51
The committees are made up of eight members and function under their respective terms of reference. These
committees are as follows:
• Audit Committee - assists the Boards in overseeing IDA’s finances, accounting, risk management and internal
controls (See further explanation below).
• Budget Committee - assists the Boards in approving the World Bank’s budget and in overseeing the preparation
and execution of IDA’s business plans. The committee provides guidance to management on strategic directions
of IDA.
• Committee on Development Effectiveness - supports the Boards in assessing IDA’s development effectiveness,
providing guidance on strategic directions of IDA, monitoring the quality and results of operations.
• Committee on Governance and Executive Directors’ Administrative Matters - assists the Boards in issues related
to the governance of IDA, the Boards’ own effectiveness, and the administrative policy applicable to Executive
Directors’ offices.
• Human Resources Committee - strengthens the efficiency and effectiveness of the Board in discharging its
oversight responsibility on the World Bank’s human resources strategy, policies and practices, and their alignment
with the business needs of the organization.
Audit Committee
Membership
The Audit Committee consists of eight Executive Directors. Membership in the Audit Committee is determined by
the Board, based on nominations by the Chairman of the Board, following informal consultation with Executive
Directors.
Key Responsibilities
The Audit Committee is appointed by the Board for the primary purpose of assisting the Board in overseeing IDA’s
finances, accounting, risk management, internal controls, and institutional integrity. Specific responsibilities include:
• Oversight of the integrity of IDA’s financial statements.
• Appointment, qualifications, independence, and performance of the External Auditor.
• Performance of the Group Internal Audit Vice Presidency.
• Adequacy and effectiveness of financial and accounting policies and internal controls and the mechanisms to
deter, prevent and penalize fraud and corruption in IDA operations and corporate procurement.
• Effective management of financial, fiduciary and compliance risks in IDA.
• Oversight of the institutional arrangements and processes for risk management across IDA.
In carrying out its role, the Audit Committee discusses financial issues and policies that affect IDA’s financial position
and capital adequacy, with management, external auditors, and internal auditors. It also recommends the annual
audited financial statements for approval to the Board. The Audit Committee monitors and reviews developments in
corporate governance and its own role on an ongoing basis.
Executive Sessions
Under the Audit Committee's terms of reference, it may convene an executive session at any time, without
management’s presence. The Audit Committee meets separately in executive session with the external and internal
auditors.
Access to Resources and to Management
Throughout the year, the Audit Committee receives a large volume of information to enable it to carry out its duties
and meets both formally and informally throughout the year to discuss relevant matters. It has complete access to
management, and reviews and discusses with management topics considered in its terms of reference.
The Audit Committee has the authority to seek advice and assistance from outside legal, accounting, or other advisors
as it deems necessary.
Auditor Independence
The appointment of the external auditor for IDA is governed by a set of Board-approved principles. These include:

Section XI: Governance and Internal Controls
52 June 30, 2022
• Limits on the external auditor’s provision of non-audit-related services;
• Requiring all audit-related services to be pre-approved on a case-by-case basis by the Board, upon
recommendation of the Audit Committee; and
• Renewal of the external audit contract every five years, with a limit of two consecutive terms and mandatory
rotation thereafter.
The external auditor may provide non-prohibited, non-audit related services subject to monetary limits.
Broadly, the list of prohibited non-audit services includes those that would put the external auditor in the roles typically
performed by management and in a position of auditing their own work, such as accounting services, internal audit
services, and provision of investment advice. The total non-audit services fees over the term of the relevant external
audit contract shall not exceed 70 percent of the audit fees over the same period.
Communication between the external auditor and the Audit Committee is ongoing and carried out as often as deemed
necessary by either party. The Audit Committee meets periodically with the external auditor and individual committee
members have independent access to the external auditor. IDA’s external auditors also follow the communication
requirements with the Audit Committee set out under generally accepted auditing standards in the United States.
External Auditors
The external auditor is appointed to a five-year term, with a limit of two consecutive terms, and is subject to annual
reappointment based on the recommendation of the Audit Committee and approval of a resolution by the Board.
Following a mandatory rebidding of the external audit contract, IDA’s Board approved the selection of Deloitte &
Touche LLP as IDA’s external auditor for a five-year term from FY19 through FY23, subject to annual reappointment.
In addition, in May 2022, IDA’s Board approved Deloitte & Touche LLP as IDA’s external auditor for a second five-
year term commencing in FY24.
Senior Management Changes
The following changes were effective January 1, 2022:
• Jingdong Hua, Vice President and Treasurer of the World Bank, retired.
• Jorge Familiar was appointed to the role of Vice President and Treasurer of the World Bank.
• Pamela O’Connell was appointed as the Vice President and World Bank Group Controller, succeeding Jorge
Familiar in that role.
Internal Controls
Internal Control over Financial Reporting
Each fiscal year, management evaluates the internal control over financial reporting to determine whether any changes
made in these controls during the fiscal year materially affect, or would be reasonably likely to materially affect,
IDA’s internal control over financial reporting. The internal control framework promulgated by the Committee of
Sponsoring Organizations of the Treadway Commission (COSO), “Internal Control - Integrated Framework (2013)”
provides guidance for designing, implementing, and conducting internal control and assessing its effectiveness. IDA
uses the 2013 COSO framework to assess the effectiveness of the internal control over financial reporting. As of June
30, 2022, management maintained effective internal control over financial reporting. See “Management’s report
regarding effectiveness of Internal Control over Financial Reporting” on page 58.
IDA’s internal control over financial reporting was audited by Deloitte & Touche LLP, and their report expresses an
unqualified opinion on the effectiveness of IDA’s internal control over financial reporting as of June 30, 2022. See
Independent Auditor’s Report on page 60.
Disclosure Controls and Procedures
Disclosure controls and procedures are designed to ensure that information required to be disclosed is gathered and
communicated to management as appropriate, to allow timely decisions regarding required disclosure by IDA.
Management conducted an evaluation of the effectiveness of such controls and procedures and the President and the
MDCFO have concluded that these controls and procedures were effective as of June 30, 2022.

Appendix
June 30, 2022 53
Appendix
Glossary of Terms
Blend Borrower: IDA Member that is eligible to borrow from IDA on the basis of per capita income and is also
eligible to borrow from IBRD. Given the access to both sources of funds, blend borrowers are expected to limit IDA
funding to social sector projects and to use IBRD resources for projects in the other sectors.
Board: The Executive Directors as established by IDA’s Articles of Agreement.
Replenishment Envelope: Total value of resources available during a particular replenishment including member
equity contributions, borrowings, internal resources, IBRD transfers, IFC grants and other resources.
Completion Point: When conditions specified in the legal notification sent to a country are met and the country’s
other creditors have confirmed their full participation in the HIPC debt relief initiative. When a country reaches its
Completion Point, IDA’s commitment to provide the total debt relief for which the country is eligible, becomes
irrevocable.
Consultative Loss Limit: Reflects a level of IDA’s tolerance for risk of underperforming the benchmark in any fiscal
year.
Credit Valuation Adjustment (CVA): The CVA represents the counterparty credit risk exposure and is reflected in
the fair value of derivative instruments.
Debit Valuation Adjustment (DVA): DVA on Fair Value Option (FVO) Elected Liabilities that corresponds to the
change in fair value of the liability presented under the FVO that relates to the instrument specific credit risk (“own-
credit risk”).
Deputies: Representatives of IDA’s contributing partners, known as “the IDA Deputies”.
Duration: Provides an indication of the sensitivity of underlying yield to changes in interest rates.
Encashment: Draw down (payment in cash) of a demand note in accordance with a schedule agreed for each
replenishment.
Externally Financed Output (EFO): An instrument for receiving external contributions to support the Bank’s work
program, typically, for amounts under $1 million, however larger amounts can also be received.
Graduate Member: A member country that was once eligible to borrow from IDA, however due to improvements in
the member’s economic results is no longer eligible to borrow from IDA and is deemed to have “graduated” to IBRD.
Instrument of Commitment (IoC): The instrument through which a government commits to make a subscription or
a subscription and contribution to IDA’s resources.
Lending operations: Total projects from a fiscal year based on project approval date as of June 30 of the fiscal year.
Net Commitments: Commitments of Loans, grants and guarantees, net of full cancellations and terminations
approved in the same fiscal year.
Net Disbursements: Loans and grant disbursements net of repayments and prepayments.
Prudential Minimum: The minimum amount of liquidity that IDA is required to hold. It represents 80% of twenty-
four months coverage as calculated at the start of every fiscal year.
Replenishment: The process of regular review of the adequacy of IDA resources and authorization of additional
subscriptions. Under IDA’s Articles, replenishments are required to be approved by IDA’s Board of Governors by a
two-thirds majority of the total voting power.
Special Drawing Rights (SDR): The SDR is an international reserve asset, created by the International Monetary
Fund in 1969 to supplement the existing official reserves of member countries. The SDR is defined as a basket of
currencies, consisting of the Chinese Renminbi, Euro, Japanese Yen, Pound Sterling, and U.S. dollar. The basket
composition is reviewed every five years to ensure that it reflects the relative importance of currencies in the world’s
trading and financial systems.
Voting Rights: IDA’s voting rights consist of a combination of membership and subscription votes.
World Bank (WB): The World Bank consists of IBRD and IDA.
World Bank Group (WBG): The World Bank Group consists of the IBRD, IDA, IFC, MIGA and ICSID.

Appendix
54 June 30, 2022
List of Tables, Figures and Boxes
Tables
Table 1: Results for IDA19 Sources and Uses 8
Table 2: Cumulative Net Commitments during the IDA19 replenishment period 9
Table 3: IDA20 Sources and allocation 9
Table 4: Utilization of PSW Commitments 13
Table 5: Condensed Statement of Income 16
Table 6: Condensed Balance Sheet 17
Table 7: Changes in Equity 17
Table 8: Provision for losses on loans and other exposures 18
Table 9: Net Loans Outstanding Activity 18
Table 10: Gross Disbursements of Loans and Grants by Region 18
Table 11: Revenue and Balances by Product Category 19
Table 12: Net Non-Interest Expenses 21
Table 13: Budget Anchor 21
Table 14: Other (Expenses) Revenue, net 22
Table 15: Unrealized Mark-to-Market gains (losses) on non-trading portfolios, net 22
Table 16: Cumulative Loans approved under the Single Currency program 26
Table 17: Summary of Financial Terms for IDA Grants and Lending Products, effective July 1, 2022 26
Table 18: Net Commitments of Loans by Region 27
Table 19: Net Commitments of Grants by Region 28
Table 20: Types of Guarantees 29
-Based and Policy-Based Guarantees, effective July 1, 2022 29
Table 22: Cash and Investment Assets Held in Trust by IDA 31
Table 23: Investments-Trading Portfolio Composition 33
Table 24: Average Balances and Returns by Sub-Portfolio 33
Table 25: Borrowings 35
Table 26: Summary of IDA's Specific Risk Categories 40
Table 27: Deployable Strategic Capital Ratio 41
Table 28: Treatment of Overdue Payments 43
45
Table 30: Commercial Credit Exposure, Net of Collateral Held, by Counterparty Rating 45
Figures
Figure 1: IDA's Financial Business Model 7
Figure 2: Funding Allocation during IDA19 replenishment period 8
Figure 3: Allocation of IDA20 Resources 10
Figure 4: Overview of IDA 20 Financing Terms 11
Figure 5: Net Loans Outstanding 18
Figure 6: Net Investment Portfolio 19
Figure 7: Net Investment Revenue 19
Figure 8: Borrowings 20
Figure 9: Budget Anchor 22
Figure 10: Net Annual Commitments and share of financing categories 25
Figure 11: Net Investment Portfolio 33
Figure 12: Effect of Derivatives on Currency Composition of the Borrowing PortfolioJune 30, 2022 36
Figure 13: Medium- and Long-Term Borrowings Issued by Currency during the year, Excluding Derivatives 36
Figure 14: Financial and Operational Risk Management Structure 37
Figure 15: Management Risk Committee Structure for Financial and Operational Risks 38
Figure 16: Country Exposures as of June 30, 2022 42
Figure 17: Use of Derivatives for Market Borrowings 46
Figure 18: Governance Structure 50


Appendix
56 June 30, 2022
This page intentionally left blank
IDA FINANCIAL STATEMENTS: JUNE 30, 2022 57
INTERNATIONAL DEVELOPMENT ASSOCIATION
FINANCIAL STATEMENTS AND INTERNAL CONTROL REPORTS
JUNE 30, 2022
Management’s Report Regarding Effectiveness of Internal Control Over Financial Reporting 58
Independent Auditor’s Report on Effectiveness of Internal Control Over Financial Reporting 60
Independent Auditor’s Report 62
Balance Sheet 66
Statement of Income 68
Statement of Comprehensive Income 69
Statement of Changes in Accumulated Deficit 69
Statement of Cash Flows 70
Supplementary Information
Summary Statement of Loans 72
Statement of Voting Power and Subscriptions and Contributions 75
Notes to Financial Statements 79
58 IDA FINANCIAL STATEMENTS: JUNE 30, 2022
MANAGEMENT’S REPORT REGARDING EFFECTIVENESS OF
INTERNAL CONTROL OVER EXTERNAL FINANCIAL REPORTING
Management’s Report Regarding Effectiveness of
Internal Control over Financial Reporting
August 5, 2022
The management of the International Development Association (IDA) is responsible for the
preparation, integrity, and fair presentation of its published financial statements. The financial
statements have been prepared in accordance with accounting principles generally accepted in the
United States of America and include amounts based on informed judgments and estimates made
by management.
The financial statements have been audited by an independent audit firm, which was given
unrestricted access to all financial records and related data, including minutes of all meetings of
the Executive Directors and their Committees. Management believes that all representations made
to the independent auditors during their audit of IDA’s financial statements and audit of its internal
control over financial reporting were valid and appropriate. The independent auditors’ reports
accompany the audited financial statements.
Management is responsible for establishing and maintaining effective internal control over
financial reporting for financial statement presentations in conformity with accounting principles
generally accepted in the United States of America. Management maintains a comprehensive
system of controls intended to ensure that transactions are executed in accordance with
management’s authorization, assets are safeguarded, and financial records are reliable. The system
of internal control contains monitoring mechanisms, and actions are taken to correct deficiencies
identified. Management believes that internal control over financial reporting supports the
integrity and reliability of the external financial statements.
There are inherent limitations in the effectiveness of any internal control, including the possibility
of human error and the circumvention or overriding of controls. Accordingly, even effective
internal controls can provide only reasonable assurance with respect to financial statement
preparation. Further, because of changes in conditions, the effectiveness of internal controls may
vary over time.
IDA assessed its internal control over financial reporting for financial statement presentation in
conformity with accounting principles generally accepted in the United States of America as of
June 30, 2022. This assessment was based on the criteria for effective internal control over
financial reporting described in the Internal Control-Integrated Framework (2013) issued by the
Committee of Sponsoring Organizations of the Treadway Commission. Based upon this
assessment, management believes that IDA maintained effective internal control over financial
reporting presented in conformity with accounting principles generally accepted in the United
States of America as of June 30, 2022. The independent audit firm that audited the financial
statements has issued an Independent Auditors Report which expresses an opinion on IDA’s
internal control over financial reporting.
IDA FINANCIAL STATEMENTS: JUNE 30, 2022 59
The Executive Directors of IDA have appointed an Audit Committee responsible for monitoring
the accounting practices and internal controls of IDA. The Audit Committee is comprised entirely
of Executive Directors who are independent of IDA’s management. The Audit Committee is
responsible for recommending to the Executive Directors the selection of independent auditors. It
meets periodically with management, the independent auditors, and the internal auditors to ensure
that they are carrying out their responsibilities. The Audit Committee is responsible for performing
an oversight role by reviewing and monitoring the financial, accounting and auditing procedures
of IDA in addition to reviewing IDA’s financial reports. The independent auditors and the internal
auditors have full and free access to the Audit Committee, with or without the presence of
management, to discuss the adequacy of internal control over financial reporting and any other
matters which they believe should be brought to the attention of the Audit Committee.
________________________
David Malpass
President
________________________
Anshula Kant
Managing Director and World Bank Group Chief Financial Officer
________________________
Pamela O'Connell
Vice President and World Bank Group Controller

60
INDEPENDENT AUDITOR’S REPORT ON MANAGEMENT’ S ASSERTION
REGARDING EFFECTIVENESS OF INTERNAL CONTROL OVER
FINANCIAL REPORTING
INDEPENDENT AUDITOR'S REPORT
President and Board of Executive Directors
International Development Association
Opinion on Internal Control over Financial Reporting
We have audited the internal control over financial reporting of International Development Association
(“IDA”) as of June 30, 2022, based on the criteria established in the Internal Control — Integrated
Framework (2013) issued by the Committee of Sponsoring Organizations of the Treadway Commission
(COSO). In our opinion, IDA maintained, in all material respects, effective internal control over financial
reporting as of June 30, 2022, based on the criteria established in the Internal Control — Integrated
Framework (2013) issued by COSO.
We also have audited, in accordance with auditing standards generally accepted in the United States of
America (GAAS), the financial statements as of and for the year ended June 30, 2022 of IDA, and our
report dated August 5, 2022, expressed an unmodified opinion on those financial statements.
Basis for Opinion
We conducted our audit in accordance with GAAS. Our responsibilities under those standards are further
described in the Auditor’s Responsibilities for the Audit of Internal Control over Financial Reporting
section of our report. We are required to be independent of IDA and to meet our other ethical
responsibilities, in accordance with the relevant ethical requirements relating to our audit. We believe
that the audit evidence we have obtained is sufficient and appropriate to provide a basis for our audit
opinion.
Responsibilities of Management for Internal Control over Financial Reporting
Management is responsible for designing, implementing, and maintaining effective internal control over
financial reporting, and for its assessment about the effectiveness of internal control over financial
reporting, included in the accompanying Management’s Report Regarding Effectiveness of Internal
Control over Financial Reporting.
Auditor’s Responsibilities for the Audit of Internal Control over Financial Reporting
Our objectives are to obtain reasonable assurance about whether effective internal control over financial
reporting was maintained in all material respects and to issue an auditor’s report that includes our
opinion on internal control over financial reporting. Reasonable assurance is a high level of assurance but
is not absolute assurance and therefore is not a guarantee that an audit of internal control over financial
reporting conducted in accordance with GAAS will always detect a material weakness when it exists.
In performing an audit of internal control over financial reporting in accordance with GAAS, we:
• Exercise professional judgment and maintain professional skepticism throughout the audit.
Deloitte & Touche LLP
7900 Tysons One Place
Suite 800
McLean, VA 22102
USA
Tel: +1 703 251 1000
Fax: +1 703 251 3400
www.deloitte.com

61
• Obtain an understanding of internal control over financial reporting, assess the risks that a
material weakness exists, and test and evaluate the design and operating effectiveness of internal
control over financial reporting based on the assessed risk.
Definition and Inherent Limitations of Internal Control over Financial Reporting
An entity’s internal control over financial reporting is a process effected by those charged with
governance, management, and other personnel, designed to provide reasonable assurance regarding the
preparation of reliable financial statements in accordance with accounting principles generally accepted
in the United States of America. An entity’s internal control over financial reporting includes those
policies and procedures that (1) pertain to the maintenance of records that, in reasonable detail,
accurately and fairly reflect the transactions and dispositions of the assets of the entity; (2) provide
reasonable assurance that transactions are recorded as necessary to permit preparation of financial
statements in accordance with accounting principles generally accepted in the United States of America,
and that receipts and expenditures of the entity are being made only in accordance with authorizations of
management and those charged with governance; and (3) provide reasonable assurance regarding
prevention, or timely detection and correction of unauthorized acquisition, use, or disposition of the
entity’s assets that could have a material effect on the financial statements.
Because of its inherent limitations, internal control over financial reporting may not prevent, or detect
and correct, misstatements. Also, projections of any assessment of effectiveness to future periods are
subject to the risk that controls may become inadequate because of changes in conditions, or that the
degree of compliance with the policies or procedures may deteriorate.
August 5, 2022

62
INDEPENDENT AUDITOR’S REPORT
INDEPENDENT AUDITOR'S REPORT
President and Board of Executive Directors
International Development Association
Opinion
We have audited the accompanying financial statements of International Development Association
("IDA"), which comprise the balance sheets as of June 30, 2022 and 2021, and the related statements of
income, comprehensive income, changes in accumulated deficit, and cash flows for each of the three
years in the period ended June 30, 2022, and the related notes to the financial statements (collectively
referred to as the "financial statements").
In our opinion, the accompanying financial statements present fairly, in all material respects, the financial
position of IDA as of June 30, 2022 and 2021, and the results of its operations and its cash flows for each
of the three years in the period ended June 30, 2022, in accordance with accounting principles generally
accepted in the United States of America.
We have also audited, in accordance with auditing standards generally accepted in the United States of
America (GAAS), IDA’s internal control over financial reporting as of June 30, 2022, based on criteria
established in Internal Control — Integrated Framework (2013) issued by the Committee of Sponsoring
Organizations of the Treadway Commission and our report dated August 5, 2022, expressed an
unmodified opinion on IDA’s internal control over financial reporting.
Basis for Opinion
We conducted our audits in accordance with GAAS. Our responsibilities under those standards are further
described in the Auditor’s Responsibilities for the Audit of the Financial Statements section of our report.
We are required to be independent of IDA and to meet our other ethical responsibilities, in accordance
with the relevant ethical requirements relating to our audits. We believe that the audit evidence we have
obtained is sufficient and appropriate to provide a basis for our audit opinion.
Change in Accounting Principle
As described in Note A to the financial statements, IDA changed its method of accounting for the
accumulated provision for loan losses and other exposures on July 1, 2020, due to the adoption of
Accounting Standards Update No. 2016-13, Financial Instruments – Credit Losses (Topic 326):
Measurement of Credit Losses on Financial Instruments. Our opinion is not modified with respect to this
matter.
Responsibilities of Management for the Financial Statements
Management is responsible for the preparation and fair presentation of the financial statements in
accordance with accounting principles generally accepted in the United States of America, and for the
design, implementation, and maintenance of internal control relevant to the preparation and fair
Deloitte & Touche LLP
7900 Tysons One Place
Suite 800
McLean, VA 22102
USA
Tel.: +1 703 251 1000
Fax: +1 703 251 3400
www.deloitte.com
63
presentation of financial statements that are free from material misstatement, whether due to fraud or
error.
In preparing the financial statements, management is required to evaluate whether there are conditions
or events, considered in the aggregate, that raise substantial doubt about IDA’s ability to continue as a
going concern for one year after the date that the financial statements are issued.
Auditor’s Responsibilities for the Audit of the Financial Statements
Our objectives are to obtain reasonable assurance about whether the financial statements as a whole are
free from material misstatement, whether due to fraud or error, and to issue an auditor’s report that
includes our opinion. Reasonable assurance is a high level of assurance but is not absolute assurance and
therefore is not a guarantee that an audit conducted in accordance with GAAS will always detect a
material misstatement when it exists. The risk of not detecting a material misstatement resulting from
fraud is higher than for one resulting from error, as fraud may involve collusion, forgery, intentional
omissions, misrepresentations, or the override of internal control. Misstatements are considered material
if there is a substantial likelihood that, individually or in the aggregate, they would influence the judgment
made by a reasonable user based on the financial statements.
In performing an audit in accordance with GAAS, we:
• Exercise professional judgment and maintain professional skepticism throughout the audit.
• Identify and assess the risks of material misstatement of the financial statements, whether due to
fraud or error, and design and perform audit procedures responsive to those risks. Such procedures
include examining, on a test basis, evidence regarding the amounts and disclosures in the financial
statements.
• Obtain an understanding of internal control relevant to the audit in order to design audit procedures
that are appropriate in the circumstances.
• Evaluate the appropriateness of accounting policies used and the reasonableness of significant
accounting estimates made by management, as well as evaluate the overall presentation of the
financial statements.
• Conclude whether, in our judgment, there are conditions or events, considered in the aggregate, that
raise substantial doubt about IDA’s ability to continue as a going concern for a reasonable period of
time.
We are required to communicate with those charged with governance regarding, among other matters,
the planned scope and timing of the audit, significant audit findings, and certain internal control-related
matters that we identified during the audit.
Report on Supplementary Information
Our audits were conducted for the purpose of forming an opinion on the financial statements as a whole.
The supplementary information listed in the table of contents is presented for the purpose of additional
analysis and are not a required part of the financial statements. These schedules are the responsibility
IDA's management and were derived from and relate directly to the underlying accounting and other

64
records used to prepare the financial statements. Such schedules have been subjected to the auditing
procedures applied in our audits of the financial statements and certain additional procedures, including
comparing and reconciling such information directly to the underlying accounting and other records used
to prepare the financial statements or to the financial statements themselves, and other additional
procedures in accordance with GAAS. In our opinion, such information is fairly stated in all material
respects in relation to the financial statements as a whole.
Other Information Included in Management’s Discussion & Analysis and Financial Statements
Management is responsible for the other information included in Management’s Discussion & Analysis
and Financial Statements. The other information comprises the information included in Management’s
Discussion & Analysis and Financial Statements but does not include the financial statements and our
auditor’s report thereon. Our opinion on the financial statements does not cover the other information,
and we do not express an opinion or any form of assurance thereon.
In connection with our audits of the financial statements, our responsibility is to read the other
information and consider whether a material inconsistency exists between the other information and the
financial statements, or the other information otherwise appears to be materially misstated. If, based on
the work performed, we conclude that an uncorrected material misstatement of the other information
exists, we are required to describe it in our report.
August 5, 2022
65
INTERNATIONAL DEVELOPMENT ASSOCIATION
FINANCIAL STATEMENTS
JUNE 30, 2022

66 IDA FINANCIAL STATEMENTS: JUNE 30, 2022
BALANCE SHEET
June 30, 2022 and June 30, 2021
Expressed in millions of U.S. dollars
2022
2021
Assets
Due from banks—Notes C and K
Unrestricted cash
$
662
$
470
Restricted cash
24
26
686
496
Investments (including securities transferred under repurchase or
securities lending agreements of Nil - June 30, 2022; Nil - June 30,
2021) —Notes C, G and K
39,827
37,376
Derivative assets, net—Notes C, F, G and K
404
249
Receivable from affiliated organization—Note G
1,006
865
Other receivables
Receivable from investment securities traded—Note C
9
7
Accrued interest and commitment charges
531
511
540
518
Loans outstanding (Summary statement of loans, Notes D, G and K)
Total loans approved
250,300
251,676
Less: Undisbursed balance (including signed loan
commitments of $61,812 million—June 30, 2022; $60,775
million—June 30, 2021)
(72,209)
(70,172)
Loans outstanding
178,091
181,504
Less: Accumulated provision for loan losses
(3,583)
(3,718)
Deferred loan income
(18)
(7)
Net loans outstanding
174,490
177,779
Other assets—Note H and I
3,061
2,041
Total assets
$
220,014
$
219,324

IDA FINANCIAL STATEMENTS: JUNE 30, 2022 67
2022
2021
Liabilities
Borrowings—Notes E and K
Market borrowings, at fair value
$
19,718
$
20,555
Market borrowings, at amortized cost
6,201
-
Concessional partner loans, at amortized cost
6,980
7,759
32,899
28,314
Derivative liabilities, net—Notes C, F, G and K
579
408
Payable for development grants—Note I
4,615
6,820
Payable to affiliated organization—Note G
578
561
Other liabilities
Payable for investment securities purchased—Note C
343
73
Accounts payable and miscellaneous liabilities—Notes D and H
2,332
2,272
2,675
2,345
Total liabilities
41,346
38,448
Equity
Members' subscriptions and contributions (Statement of voting
power and subscriptions and contributions and Note B)
Unrestricted
289,214
292,210
Restricted
322
324
Subscriptions and contributions committed
289,536
292,534
Less:
Subscriptions and contributions receivable
(27,902)
(38,240)
Cumulative discounts/ credits on subscriptions and contributions, net
(3,857)
(3,842)
Subscriptions and contributions paid-in
257,777
250,452
Nonnegotiable, noninterest-bearing demand obligations on account
of members' subscriptions and contributions
Unrestricted
(10,120)
(11,382)
Restricted
(47)
(50)
(10,167)
(11,432)
Deferred amounts to maintain value of currency holdings
(246)
(244)
Accumulated deficit (Statement of changes in accumulated deficit)
(59,544)
(59,556)
Accumulated other comprehensive (loss) income—Note J
(9,152)
1,656
Total equity
178,668
180,876
Total liabilities and equity
$
220,014
$
219,324
The Notes to Financial Statements are an integral part of these Statements.

68 IDA FINANCIAL STATEMENTS: JUNE 30, 2022
STATEMENT OF INCOME
For the fiscal years ended June 30, 2022, June 30, 2021 and June 30, 2020
Expressed in millions of U.S. dollars
2022
2021
2020
Interest revenue
Loans, net—Note D
$
1,960
$
2,050
$
1,684
Investments, net—Notes C, F, G and K
189
147
422
Asset-liability management derivatives, net—Notes F and K
1
(14)
(22)
Borrowing expenses, net—Note E
(249)
(187)
(241)
Interest revenue, net of borrowing expenses
1,901
1,996
1,843
Provision for losses on loans and other exposures, (charge) release —
Note D
(278)
539
170
Non-interest revenue
Revenue from externally funded activities—Notes G and H
865
814
902
Commitment charges—Note D
24
19
15
Other
22
17
15
Total
911
850
932
Non-interest expenses
Administrative—Notes G and H
(2,238)
(2,406)
(2,389)
Contributions to special programs—Note G
(19)
(20)
(21)
Other
(48)
20
(40)
Total
(2,305)
(2,406)
(2,450)
Transfers from affiliated organizations and others—Notes G and H
274
544
252
Development grants—Note I
(2,372)
(2,830)
(1,475)
Non-functional currency translation adjustment gains (losses), net
511
(372)
95
Unrealized mark-to-market (losses) gains on Investments-Trading
portfolio, net—Notes F and K
(104)
144
207
Unrealized mark-to-market gains (losses) on Non-Trading portfolios,
net
Asset-liability management derivatives—Notes F and K
1,441
1,080
(699)
Other non-trading portfolios—Note K
33
22
11
Total
1,474
1,102
(688)
Net income (loss)
$
12
$
(433)
$
(1,114)
The Notes to Financial Statements are an integral part of these Statements.

IDA FINANCIAL STATEMENTS: JUNE 30, 2022 69
STATEMENT OF COMPREHENSIVE INCOME
For the fiscal years ended June 30, 2022, June 30, 2021 and June 30, 2020
Expressed in millions of U.S. dollars
2022
2021
2020
Net income (loss)
$
12
$
(433)
$
(1,114)
Other Comprehensive (loss) income—Note J
Currency translation adjustments on functional currencies
(10,851)
5,647
(1,526)
Net Change in Debit Valuation Adjustment (DVA) on Fair
Value option elected liabilities
43
(64)
7
Comprehensive (loss) income
$
(10,796)
$
5,150
$
(2,633)
STATEMENT OF CHANGES IN ACCUMULATED DEFICIT
For the fiscal years ended June 30, 2022, June 30, 2021 and June 30, 2020
Expressed in millions of U.S. dollars
2022
2021
2020
Accumulated Deficit at beginning of the fiscal year
$
(59,556)
$
(58,321)
$
(57,207)
Cumulative effect of a change in accounting principle-
Note D
-
(802)
-
Adjusted Accumulated Deficit at beginning of the
fiscal year
$
(59,556)
$
(59,123)
$
(57,207)
Net income (loss)
12
(433)
(1,114)
Accumulated Deficit at end of the fiscal year
$
(59,544)
$
(59,556)
$
(58,321)
The Notes to Financial Statements are an integral part of these Statements.

70 IDA FINANCIAL STATEMENTS: JUNE 30, 2022
STATEMENT OF CASH FLOWS
For the fiscal years ended June 30, 2022, June 30, 2021 and June 30, 2020
Expressed in millions of U.S. dollars
2022
2021
2020
Cash flows from investing activities
Loans
Disbursements
$
(15,860)
$
(16,681)
$
(16,449)
Principal repayments
6,738
6,457
6,016
Principal prepayments
-
-
51
Non-trading securities—Investments
Repayments
114
125
124
Net cash used in investing activities
(9,008)
(10,099)
(10,258)
Cash flows from financing activities
Members' subscriptions and contributions
8,589
8,355
7,823
Medium and long-term borrowings
New issues
9,756
9,405
5,725
Retirements
(101)
(96)
(43)
Short-term borrowings (original maturities greater than 90 days)
New issues
5,716
8,219
12,018
Retirements
(8,131)
(9,561)
(8,178)
Net short-term borrowings (original maturities less than 90 days)
1,890
120
16
Net derivatives-borrowings
8
29
(20)
Net cash provided by financing activities
17,727
16,471
17,341
Cash flows from operating activities
Net income (loss)
12
(433)
(1,114)
Adjustments to reconcile net income (loss) to net cash used in operating
activities:
Provision for losses on loans and other exposures charge (release)
278
(539)
(170)
Non-functional currency translation adjustment (gains) losses, net
(511)
372
(95)
Unrealized mark-to-market (gains) losses on non-trading portfolios, net
(1,474)
(1,102)
688
Other non-interest expenses (income), net
48
(20)
40
Amortization of discount on borrowings
105
96
133
Changes in:
Investments—Trading
(5,936)
(2,090)
(2,323)
Net receivable/payable from investment securities traded/purchased
299
603
(155)
Net derivatives—Investments
973
160
(89)
Net derivatives—Asset-liability management
58
19
533
Net securities purchased/sold under resale/repurchase agreements
and payable for cash collateral received
775
(109)
(601)
Net receivable/payable from/to affiliated organizations
(124)
45
14
Payable for development grants
(1,808)
(2,652)
(3,070)
Accrued interest and commitment charges
(55)
(57)
(43)
Other assets
(1,171)
(1,367)
(1,279)
Accounts payable and miscellaneous liabilities
37
471
992
Net cash used in operating activities
(8,494)
(6,603)
(6,539)
Effect of exchange rate changes on unrestricted and restricted cash
(35)
53
(8)
Net increase (decrease) in unrestricted and restricted cash
190
(178)
536
Unrestricted cash and restricted cash at beginning of the fiscal year
496
674
138
Unrestricted and restricted cash at end of the fiscal year
$
686
$
496
$
674

IDA FINANCIAL STATEMENTS: JUNE 30, 2022 71
STATEMENT OF CASH FLOWS
For the fiscal years ended June 30, 2022, June 30, 2021 and June 30, 2020
Expressed in millions of U.S. dollars
2022
2021
2020
Supplemental disclosure
(Decrease) Increase in ending balances resulting from
exchange rate fluctuations:
Loans outstanding
$
(12,505)
$
5,909
$
(1,543)
Investment portfolio
(2,205)
1,180
(449)
Borrowings
(2,950)
627
(149)
Derivatives - Borrowings
446
(173)
62
Derivatives - Asset-liability management
1,253
(880)
321
Principal repayments written off under Heavily Indebted
Poor Countries (HIPC) Debt Initiative
30
9
10
Loans prepaid—carrying value
-
-
54
Interest paid on borrowing portfolio
119
118
161
The Notes to Financial Statements are an integral part of these Statements.
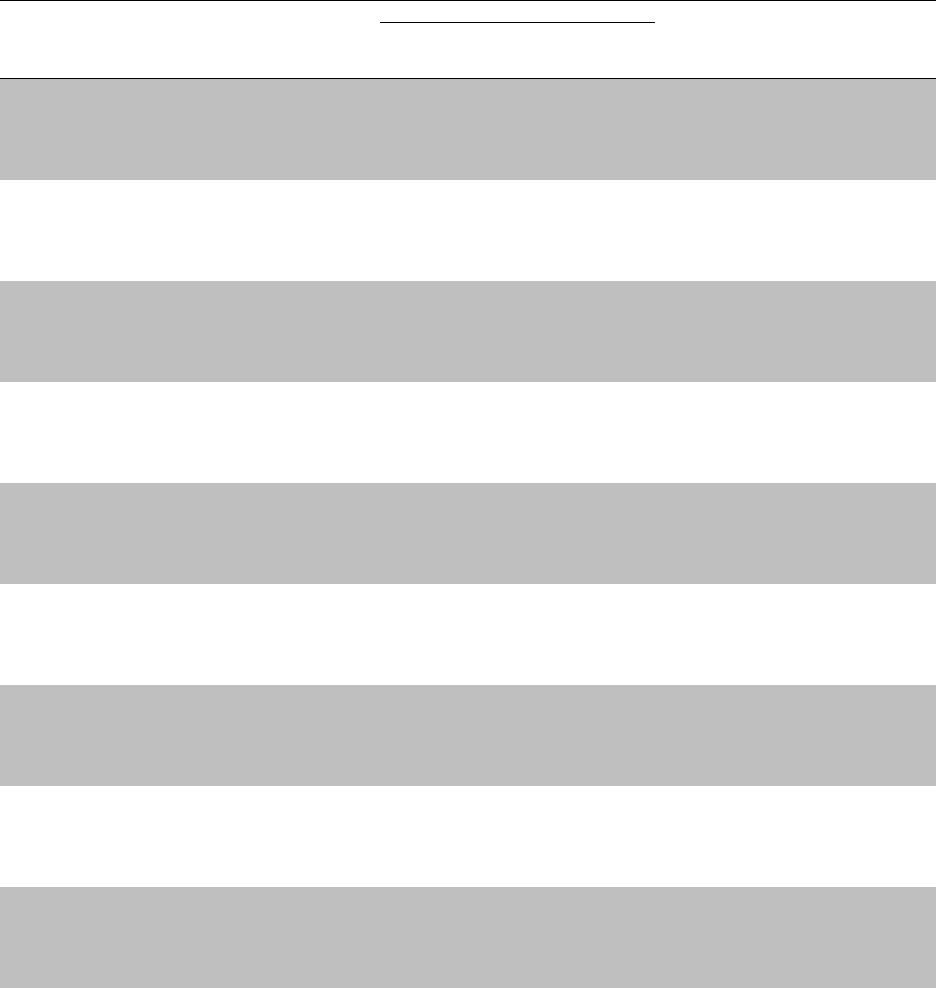
72 IDA FINANCIAL STATEMENTS: JUNE 30, 2022
SUMMARY STATEMENT OF LOANS
June 30, 2022
Amounts expressed in millions of U.S. dollars
Undisbursed balance
Borrower or guarantor
Total loans
Loans
approved but
not yet signed
Signed loan
commitments
Loans
outstanding
Percentage of
total loans
outstanding
a
Afghanistan
$
308
$
-
$
-
$
308
0.17
%
Albania
456
-
-
456
0.26
Angola
418
-
*
418
0.23
Armenia
831
-
5
826
0.46
Azerbaijan
183
-
-
183
0.10
Bangladesh
25,954
1,547
6,482
17,925
10.06
Benin
2,598
243
1,016
1,339
0.75
Bhutan
412
-
22
390
0.22
Bolivia
920
-
201
719
0.40
Bosnia and Herzegovina
814
-
-
814
0.46
Botswana
*
-
-
*
*
Burkina Faso
3,353
-
1,291
2,062
1.16
Burundi
123
-
-
123
0.07
Cabo Verde, Republic of
575
-
116
459
0.26
Cambodia
1,710
157
667
886
0.50
Cameroon
3,923
1,037
1,144
1,742
0.98
Central African Republic
126
-
-
126
0.07
Chad
159
-
-
159
0.09
China
365
-
-
365
0.20
Comoros
139
-
108
31
0.02
Congo, Democratic Republic of
4,423
76
2,327
2,020
1.13
Congo, Republic of
580
29
247
304
0.17
Côte d'Ivoire
4,934
138
2,411
2,385
1.34
Djibouti
469
-
253
216
0.12
Dominica
217
-
99
118
0.07
Dominican Republic
*
-
-
*
*
Ecuador
*
-
-
*
*
Egypt, Arab Republic of
231
-
-
231
0.13
El Salvador
1
-
-
1
*
Equatorial Guinea
16
-
-
16
0.01
Eritrea
415
-
-
415
0.23
Eswatini
*
-
-
*
*
Ethiopia
14,568
-
3,622
10,946
6.15
Fiji
317
49
28
240
0.13
Gambia, The
144
-
17
127
0.07
Georgia
762
-
4
758
0.43
Ghana
7,033
856
1,471
4,706
2.64
Grenada
298
-
101
197
0.11
Guinea
850
13
227
610
0.34
Guinea-Bissau
270
-
91
179
0.10
Guyana
194
42
57
95
0.05
Honduras
1,695
270
468
957
0.54
India
20,340
83
536
19,721
11.07
Indonesia
534
-
-
534
0.30
Iraq
248
-
-
248
0.14
Jordan
206
-
42
164
0.09
Kenya
13,630
238
3,149
10,243
5.75
Kosovo
381
-
208
173
0.10
Kyrgyz Republic
1,015
25
364
626
0.35
Lao People's Democratic Republic
1,245
-
514
731
0.41
Lebanon
95
-
10
85
0.05
Lesotho
680
71
193
416
0.23
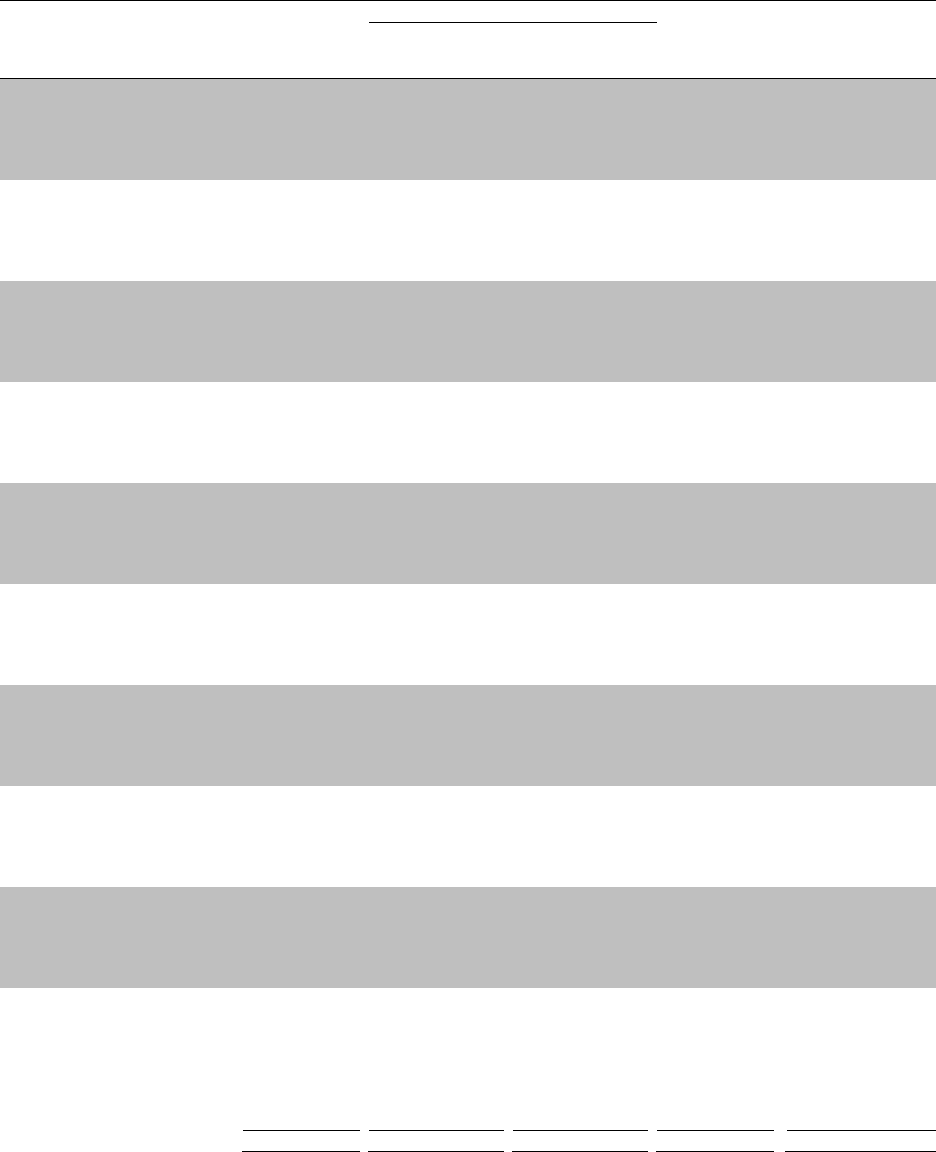
IDA FINANCIAL STATEMENTS: JUNE 30, 2022 73
SUMMARY STATEMENT OF LOANS
June 30, 2022
Amounts expressed in millions of U.S. dollars
Undisbursed balance
Borrower or guarantor
Total loans
Loans
approved but
not yet signed
Signed loan
commitments
Loans
outstanding
Percentage of
total loans
outstanding
a
Liberia
$
963
$
29
$
300
$
634
0.36
%
Madagascar
3,317
-
1,332
1,985
1.12
Malawi
2,155
240
649
1,266
0.71
Maldives
118
-
22
96
0.05
Mali
2,566
-
543
2,023
1.14
Mauritania
454
-
65
389
0.22
Mauritius
*
-
-
*
*
Moldova
1,053
136
249
668
0.38
Mongolia
927
49
129
749
0.42
Montenegro
15
-
-
15
0.01
Morocco
1
-
-
1
*
Mozambique
3,134
-
150
2,984
1.68
Myanmar
3,054
-
1,394
1,660
0.93
Nepal
5,745
489
1,228
4,028
2.26
Nicaragua
1,071
116
83
872
0.49
Niger
3,542
132
1,582
1,828
1.03
Nigeria
20,151
1,228
6,374
12,549
7.05
North Macedonia
163
-
-
163
0.09
Pakistan
20,486
863
4,063
15,560
8.74
Papua New Guinea
927
148
245
534
0.30
Paraguay
2
-
-
2
*
Philippines
15
-
-
15
0.01
Rwanda
3,441
-
839
2,602
1.46
Samoa
101
-
-
101
0.06
São Tomé and Príncipe
10
-
-
10
0.01
Senegal
5,154
-
1,625
3,529
1.98
Serbia
87
-
-
87
0.05
Sierra Leone
497
-
47
450
0.25
Solomon Islands
197
6
147
44
0.03
Somalia
110
-
-
110
0.06
South Sudan
76
-
-
76
0.04
Sri Lanka
3,552
-
517
3,035
1.70
St. Kitts and Nevis
*
-
-
*
*
St. Lucia
292
30
119
143
0.08
St. Vincent and the Grenadines
305
15
87
203
0.11
Sudan
313
-
-
313
0.18
Syrian Arab Republic
14
-
-
14
0.01
Tajikistan
513
-
160
353
0.20
Tanzania
12,638
-
4,218
8,420
4.73
Timor-Leste
268
116
114
38
0.02
Togo
649
-
310
339
0.19
Tonga
46
-
5
41
0.02
Tunisia
*
-
-
*
*
Türkiye
*
-
-
*
*
Uganda
6,581
1,036
1,136
4,409
2.48
Ukraine
985
-
959
26
0.01
Uzbekistan
4,488
400
1,802
2,286
1.28
Vanuatu
167
-
68
99
0.05
Vietnam
15,218
-
2,341
12,877
7.23
Yemen, Republic of
1,287
-
26
1,261
0.71
Zambia
2,642
365
674
1,603
0.90
Zimbabwe
438
-
-
438
0.25
Subtotal—Members
a
$
249,086
$
10,272
$
61,093
$
177,721
99.79
%

74 IDA FINANCIAL STATEMENTS: JUNE 30, 2022
SUMMARY STATEMENT OF LOANS
June 30, 2022
Amounts expressed in millions of U.S. dollars
Undisbursed balance
Borrower or guarantor
Total loans
Loans
approved but
not yet signed
Signed loan
commitments
Loans
outstanding
Percentage of
total loans
outstanding
a
African Trade Insurance Agency
$
422
$
-
$
388
$
34
0.02
%
Bank of the States of Central
Africa
55
-
13
42
0.02
Caribbean Development Bank
9
-
-
9
0.01
West African Development Bank
342
-
107
235
0.13
Subtotal—Regional
development banks
$
828
$
-
$
508
$
320
0.18
%
Private Sector Window (PSW)
Loans
386
125
211
50
0.03
Total—June 30, 2022
a
$
250,300
$
10,397
$
61,812
$
178,091
100.00
%
Total—June 30, 2021
$
251,676
$
9,397
$
60,775
$
181,504
* Indicates amount less than $0.5 million or 0.005 percent
a. May differ from the calculated amounts or sum of individual figures shown due to rounding.
The Notes to Financial Statements are an integral part of these Statements.

IDA FINANCIAL STATEMENTS: JUNE 30, 2022 75
STATEMENT OF VOTING POWER AND SUBSCRIPTIONS AND CONTRIBUTIONS
June 30, 2022
Amounts expressed in millions of U.S. dollars
Member
a
Number of votes
Percentage of total
votes
Subscriptions and
contributions
committed
b
Part I Members
Australia
369,627
1.24
%
$
5,459.93
Austria
280,620
0.94
4,076.83
Belgium
328,254
1.10
5,381.19
Canada
796,011
2.66
13,436.47
Denmark
280,433
0.94
4,250.85
Estonia
54,499
0.18
21.53
Finland
186,548
0.62
2,229.86
France
1,140,506
3.81
20,461.16
Germany
1,592,292
5.33
28,772.38
Greece
60,268
0.20
219.01
Iceland
65,969
0.22
103.65
Ireland
111,780
0.37
916.91
Italy
676,761
2.26
11,115.85
Japan
2,492,887
8.34
49,373.14
Kuwait
122,631
0.41
1,119.02
Latvia
61,003
0.20
19.57
Lithuania
54,366
0.18
19.40
Luxembourg
84,672
0.28
455.53
Netherlands
603,321
2.02
10,497.76
New Zealand
82,461
0.28
414.58
Norway
313,507
1.05
4,564.17
Portugal
77,016
0.26
338.75
Russian Federation
90,647
0.30
749.31
Slovenia
60,474
0.20
45.20
South Africa
76,935
0.26
248.56
Spain
326,300
1.09
4,909.53
Sweden
621,680
2.08
9,727.31
Switzerland
400,003
1.34
6,553.25
United Arab Emirates
1,367
-
5.58
United Kingdom
2,044,544
6.84
35,871.41
United States
2,947,708
9.86
56,214.92
Subtotal—Part I Members
b
16,405,090
54.86
%
$
277,573
Part II Members
Afghanistan
59,204
0.20
1.50
Albania
61,859
0.21
0.36
Algeria
122,959
0.41
30.53
Angola
153,438
0.51
8.35
Argentina
423,520
1.42
161.21
Armenia
65,146
0.22
0.72
Azerbaijan
72,886
0.24
6.14
Bahamas, The
59,906
0.20
8.54
Bangladesh
156,110
0.52
8.03
Barbados
62,860
0.21
2.36
Belize
19,834
0.07
0.27
Benin
60,820
0.20
0.76
Bhutan
58,732
0.20
0.08
Bolivia, Plurinational State of
79,165
0.26
1.67
Bosnia and Herzegovina
55,440
0.19
2.48

76 IDA FINANCIAL STATEMENTS: JUNE 30, 2022
STATEMENT OF VOTING POWER AND SUBSCRIPTIONS AND CONTRIBUTIONS
June 30, 2022
Amounts expressed in millions of U.S. dollars
Member
a
Number of votes
Percentage of total
votes
Subscriptions and
contributions
committed
b
Botswana
53,807
0.18
%
$
3.63
Brazil
477,996
1.60
833.48
Bulgaria
108,609
0.36
8.02
Burkina Faso
66,636
0.22
0.79
Burundi
55,801
0.19
1.09
Cabo Verde, Republic of
43,840
0.15
0.13
Cambodia
71,089
0.24
1.60
Cameroon
60,782
0.20
1.60
Central African Republic
48,910
0.16
0.77
Chad
52,210
0.17
0.78
Chile
58,505
0.20
39.11
China
723,535
2.42
2,354.76
Colombia
133,321
0.45
25.17
Comoros
47,140
0.16
0.13
Congo, Democratic Republic of
82,699
0.28
4.59
Congo, Republic of
52,210
0.17
0.74
Costa Rica
30,998
0.10
0.28
Côte d’Ivoire
67,377
0.23
1.54
Croatia
91,994
0.31
5.92
Cyprus
75,327
0.25
30.90
Czech Republic
133,572
0.45
154.77
Djibouti
48,116
0.16
0.26
Dominica
58,892
0.20
0.14
Dominican Republic
27,780
0.09
0.58
Ecuador
50,151
0.17
0.94
Egypt, Arab Republic of
134,452
0.45
18.61
El Salvador
46,516
0.16
0.49
Equatorial Guinea
6,167
0.02
0.41
Eritrea
46,536
0.16
0.14
Eswatini
22,322
0.07
0.42
Ethiopia
51,732
0.17
0.69
Fiji
19,809
0.07
0.75
Gabon
2,093
0.01
0.63
Gambia, The
55,208
0.18
0.42
Georgia
65,717
0.22
0.98
Ghana
86,677
0.29
3.12
Grenada
28,927
0.10
0.14
Guatemala
40,696
0.14
0.56
Guinea
37,287
0.12
1.33
Guinea-Bissau
44,500
0.15
0.22
Guyana
74,343
0.25
1.27
Haiti
54,538
0.18
1.11
Honduras
59,206
0.20
0.44
Hungary
208,032
0.70
164.29
India
864,601
2.89
612.98
Indonesia
256,899
0.86
139.39
Iran, Islamic Republic of
115,867
0.39
24.18
Iraq
73,199
0.24
1.11
Israel
91,185
0.30
155.17
Jordan
24,865
0.08
0.41
Kazakhstan
23,297
0.08
8.50
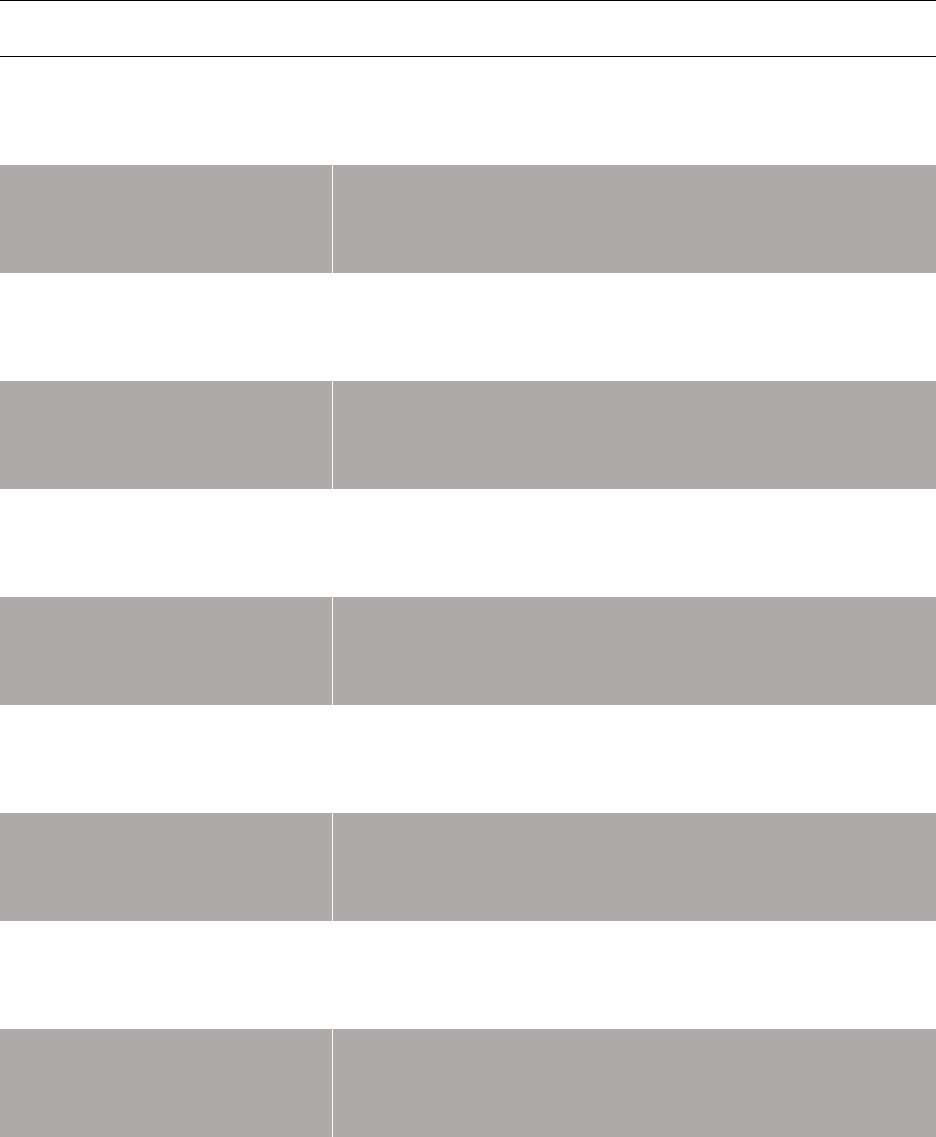
IDA FINANCIAL STATEMENTS: JUNE 30, 2022 77
STATEMENT OF VOTING POWER AND SUBSCRIPTIONS AND CONTRIBUTIONS
June 30, 2022
Amounts expressed in millions of U.S. dollars
Member
a
Number of votes
Percentage of total
votes
Subscriptions and
contributions
committed
b
Kenya
77,960
0.26
%
$
2.38
Kiribati
43,592
0.15
0.10
Korea, Republic of
310,747
1.04
2,702.37
Kosovo, Republic of
50,857
0.17
0.84
Kyrgyz Republic
64,522
0.22
0.57
Lao People's Democratic Republic
48,910
0.16
0.73
Lebanon
8,562
0.03
0.56
Lesotho
57,005
0.19
0.23
Liberia
52,038
0.17
1.12
Libya
44,771
0.15
1.31
Madagascar
70,516
0.24
1.39
Malawi
58,540
0.20
0.98
Malaysia
104,565
0.35
59.77
Maldives
55,046
0.18
0.05
Mali
62,445
0.21
1.35
Marshall Islands
4,902
0.02
0.01
Mauritania
52,210
0.17
0.78
Mauritius
75,236
0.25
1.31
Mexico
142,236
0.48
168.34
Micronesia, Federated States of
18,424
0.06
0.03
Moldova
56,582
0.19
0.88
Mongolia
45,818
0.15
0.30
Montenegro
59,594
0.20
0.76
Morocco
111,332
0.37
5.54
Mozambique
63,917
0.21
2.06
Myanmar
82,096
0.27
2.56
Nepal
54,710
0.18
0.72
Nicaragua
62,982
0.21
0.44
Niger
52,210
0.17
0.76
Nigeria
121,086
0.40
40.49
North Macedonia
47,095
0.16
1.09
Oman
59,288
0.20
1.42
Pakistan
246,431
0.82
78.12
Palau
3,804
0.01
0.03
Panama
10,185
0.03
0.03
Papua New Guinea
67,754
0.23
1.27
Paraguay
46,493
0.16
0.44
Peru
93,132
0.31
18.07
Philippines
150,947
0.50
34.32
Poland
597,334
2.00
144.63
Romania
96,010
0.32
5.08
Rwanda
52,038
0.17
1.12
Samoa
43,901
0.15
0.14
São Tomé and Principe
49,519
0.17
0.12
Saudi Arabia
1,003,435
3.36
3,205.70
Senegal
74,743
0.25
2.64
Serbia
86,096
0.29
7.08
St. Kitts and Nevis
13,868
0.05
0.17
St. Lucia
30,532
0.10
0.23
St. Vincent and the Grenadines
49,929
0.17
0.12
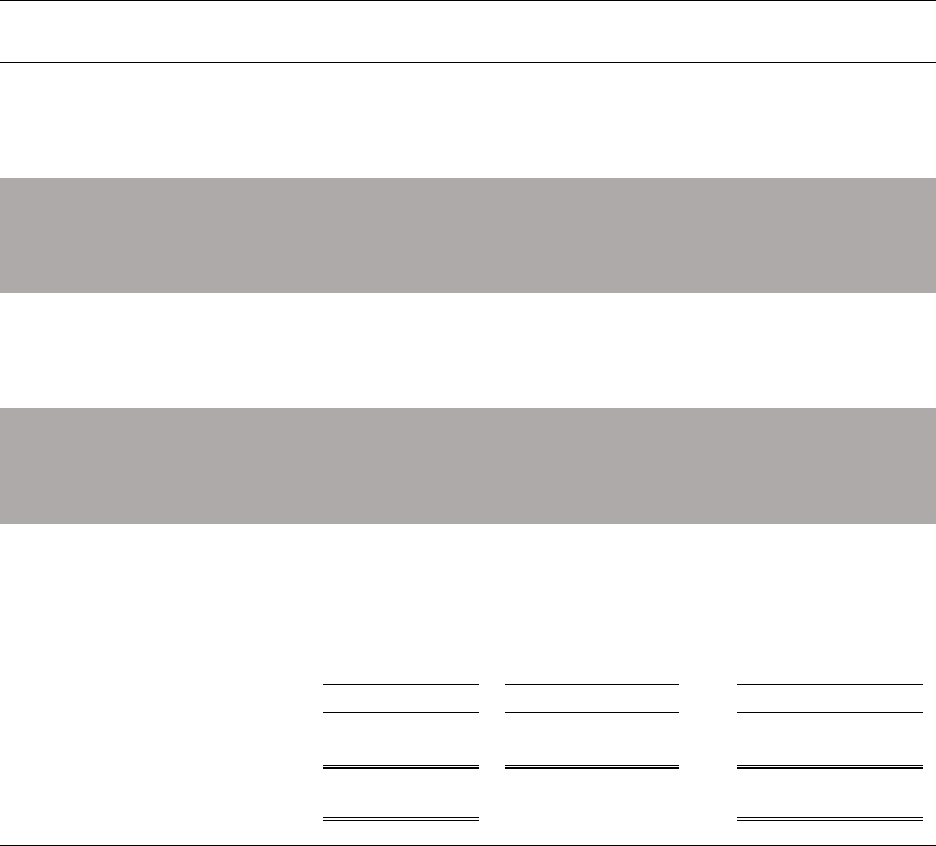
78 IDA FINANCIAL STATEMENTS: JUNE 30, 2022
STATEMENT OF VOTING POWER AND SUBSCRIPTIONS AND CONTRIBUTIONS
June 30, 2022
Amounts expressed in millions of U.S. dollars
Member
a
Number of votes
Percentage of total
votes
Subscriptions and
contributions
committed
b
Sierra Leone
63,638
0.21
%
$
1.03
Singapore
58,284
0.19
317.32
Slovak Republic
95,378
0.32
37.30
Solomon Islands
43,901
0.15
0.13
Somalia
10,506
0.04
0.95
South Sudan
52,447
0.18
0.45
Sri Lanka
106,639
0.36
4.11
Sudan
65,003
0.22
1.50
Syrian Arab Republic
14,131
0.05
1.19
Tajikistan
53,918
0.18
0.53
Tanzania
68,943
0.23
2.31
Thailand
114,375
0.38
18.38
Timor-Leste
45,123
0.15
0.44
Togo
61,840
0.21
1.18
Tonga
49,514
0.17
0.11
Trinidad and Tobago
81,067
0.27
2.13
Tunisia
2,793
0.01
1.89
Türkiye
179,011
0.60
201.84
Tuvalu
8,838
0.03
0.03
Uganda
50,392
0.17
2.31
Ukraine
115,569
0.39
8.04
Uzbekistan
73,936
0.25
1.92
Vanuatu
50,952
0.17
0.31
Vietnam
61,168
0.20
2.23
Yemen, Republic of
68,976
0.23
2.20
Zambia
87,027
0.29
3.66
Zimbabwe
105,982
0.35
6.41
Subtotal—Part II Members
b
13,493,143
45.14
%
$
11,963
Total—June 30, 2022
b
29,898,233
100.00
%
$
289,536
Total—June 30, 2021
29,361,600
$
292,534
NOTES
a. See Notes to Financial Statements—Note A for an explanation of the two categories of membership
b. May differ from the calculated amounts or sum of individual figures shown due to rounding.
The Notes to Financial Statements are an integral part of these Statements.
IDA FINANCIAL STATEMENTS: JUNE 30, 2022 79
NOTES TO FINANCIAL STATEMENTS
PURPOSE AND AFFILIATED ORGANIZATIONS
The International Development Association (IDA) is an international organization established in 1960. IDA’s main
goal is reducing poverty through promoting sustainable economic development in the less developed countries of the
world that are members of IDA, by extending concessional and non-concessional financing in the form of grants,
loans and guarantees, and by providing related technical assistance. The activities of IDA are complemented by
those of three affiliated organizations, the International Bank for Reconstruction and Development (IBRD), the
International Finance Corporation (IFC), and the Multilateral Investment Guarantee Agency (MIGA). Each of these
organizations is legally and financially independent from IDA, with separate assets and liabilities, and IDA is not
liable for their respective obligations. Transactions with these affiliates are disclosed in the notes that follow.
IDA is immune from taxation pursuant to Article VIII, Section 9, Immunities from Taxation, of IDA’s Articles of
Agreement.
NOTE A—SUMMARY OF SIGNIFICANT ACCOUNTING AND RELATED POLICIES
IDA’s financial statements are prepared in conformity with accounting principles generally accepted in the United
States of America (U.S. GAAP).
The preparation of financial statements in conformity with U.S. GAAP requires management to make estimates and
assumptions that affect the reported amounts of assets and liabilities and disclosures of contingent assets and
liabilities at the date of the financial statements and the reported amounts of revenue and expenses during the
reporting period. Due to the inherent uncertainty involved in making those estimates, actual results could differ from
these estimates. Significant judgment has been used in the valuation of certain financial instruments and the
determination of the adequacy of the accumulated provisions for debt relief and losses on loans and other exposures
that include signed loan commitments, including deferred drawdown options that are effective and irrevocable
commitments, guarantees and repaying project preparation facilities.
On August 5, 2022, the Executive Directors approved these financial statements for issue, which was also the date
through which IDA’s management evaluated subsequent events.
Certain reclassifications to the prior year’s information have been made to conform with the current year’s
presentation.
Translation of Currencies
IDA’s financial statements are expressed in U.S. dollars for the purpose of reporting its financial position and the
results of its operations.
IDA conducts its operations in Special Drawing Rights (SDR) and its component currencies of the U.S. dollar, euro,
Japanese yen, pound sterling and Chinese renminbi. These constitute the functional currencies of IDA.
Assets and liabilities are translated at market exchange rates in effect at the end of the reporting period. Revenue and
expenses are translated at either the market exchange rates in effect on the dates of revenue and expense recognition,
or at an average of the market exchange rates in effect during the month. Translation adjustments relating to the
revaluation of all assets and liabilities denominated in either SDR or the component currencies of SDR, are reflected
in Accumulated Other Comprehensive Income. Translation adjustments relating to other currencies (non-functional
currencies) are reported in the Statement of Income.
Members’ Subscriptions and Contributions
Recognition
Members’ subscriptions and contributions committed for each IDA replenishment are initially recorded as both
subscriptions and contributions committed and, correspondingly, as subscriptions and contributions receivable. Prior
to effectiveness, only a portion of the value of Instruments of Commitment (IoCs) received as specified in the
replenishment resolution is recorded as subscriptions and contributions committed. Upon effectiveness, the
remainder of the value of IoCs received is subsequently recorded as subscriptions and contributions committed.
80 IDA FINANCIAL STATEMENTS: JUNE 30, 2022
IoCs can contain unqualified or qualified commitments. Under an unqualified commitment, a contributing member
agrees to pay a specified amount of its subscription and contribution without requiring appropriation legislation. A
qualified commitment is subject to the contributing member obtaining the necessary appropriation legislation.
Subscriptions and contributions made under IoCs become available for commitment for loans, grants and guarantees
by IDA for a particular replenishment in accordance with the IDA replenishment envelope as approved by the
Executive Directors.
A replenishment becomes effective when IDA receives IoCs from members whose subscriptions and contributions
aggregate to a specified portion of the full replenishment. Amounts not yet paid in at the date of effectiveness, are
recorded as subscriptions and contributions receivable and shown as a reduction of subscriptions and contributions
committed. These receivables become due throughout the replenishment period, generally three years, in accordance
with an agreed payment schedule. The actual payment of receivables when they become due may be subject to the
budgetary appropriation processes for certain members.
The subscriptions and contributions receivable are settled through payment of cash or deposit of nonnegotiable, non-
interest bearing demand notes. The notes are encashed by IDA on an approximately pro rata basis either as provided
in the relevant replenishment resolution over the disbursement period of the loans and grants committed under the
replenishment, or as needed.
In certain replenishments, donors receive discounts (a reduced obligation) when they pay a contribution amount
before the relevant due date, and acceleration credits when they pay their full contribution amount before the due
date. IDA retains any related revenue earned on these early payments, with subscriptions and contributions
committed being recorded at contribution amounts received, grossed up for discounts and acceleration credits.
Acceleration credits and discounts are presented on the Balance Sheet in the line item cumulative discounts/credits
on subscriptions and contributions, net. The discounts and acceleration credits are deducted in arriving at the
subscriptions and contributions paid-in.
Under the Seventeenth Replenishment of IDA’s Resources (IDA17), which became effective beginning fiscal year
ended June 30, 2015, IDA’s Executive Directors approved the use of a limited amount of concessional debt funding,
referred to as concessional partner loans (CPL), which continued in the subsequent Replenishments of IDA’s
Resources. The borrowing terms of this concessional debt funding aim to match the concessional features of IDA’s
loans. Proceeds received under this arrangement have two separate components: (1) a borrowing component and (2)
a grant component, for which voting rights are allocated to providers of the CPL. The borrowing component of the
CPL is recognized and reported at amortized cost (see borrowings section for more details). The grant component is
calculated as a function of the terms of the loan and the discount rate agreed upon during the replenishment
discussions. This grant component is recorded as equity, equivalent to the cash received.
For the purposes of determining its subscriptions and contributions, the membership of IDA is divided into two
categories: (1) Part I members, which make payments of subscriptions and contributions provided to IDA in
convertible currencies that may be freely used or exchanged by IDA in its operations and (2) Part II members, which
make payments of ten percent of their initial subscriptions in freely convertible currencies, and the remaining 90
percent of their initial subscriptions, and all additional subscriptions and contributions, in their own currencies or in
freely convertible currencies. Certain Part II members provide a portion of their subscriptions and contributions in
the same manner as mentioned in (1) above. IDA’s Articles of Agreement and subsequent replenishment resolutions
provide that the currency of any Part II member paid in by it may not be used by IDA for projects financed by IDA
and located outside the territory of the member except by agreement between the member and IDA. The national
currency portion of subscriptions of Part II members is recorded as restricted under Members’ subscriptions and
contributions unless released under an agreement between the member and IDA, or used for administrative
expenses. The cash paid and notes deposited in nonconvertible local currencies for the subscriptions of Part II
members are recorded either as Restricted cash under Due from Banks, or as restricted notes included under
Nonnegotiable, Noninterest-bearing Demand Obligations on Account of Members’ subscriptions and contributions.
Following adoption by the Board of Governors on April 21, 2006 of a resolution authorizing additions to IDA’s
resources to finance the MDRI (Multilateral Debt Relief Initiative), pledges received in the form of IoCs for
financing the MDRI are recorded and accounted for in their entirety. Therefore, the full value of all IoCs received is
recorded as Subscriptions and contributions committed. Correspondingly, the IoCs are recorded as Subscriptions and
contributions receivable and deducted from equity.
IDA FINANCIAL STATEMENTS: JUNE 30, 2022 81
Withdrawal of Membership
Under IDA’s Articles of Agreement, a member may withdraw from membership in IDA at any time. When a
government ceases to be a member, it remains liable for all financial obligations undertaken by it to IDA, whether as
a member, borrower, guarantor or otherwise. The Articles provide that upon withdrawal, IDA and the government
shall proceed to a settlement of accounts. If agreement is not reached within six months, standard arrangements are
provided. Under these arrangements, IDA would pay to the government the lower of the member’s total paid-in
subscriptions and contributions or the member’s proportionate share of IDA’s net assets. These funds would be paid
as a proportionate share of all principal repayments received by IDA on loans made during the period of the
government’s membership.
Valuation of Subscriptions and Contributions
The subscriptions and contributions provided through the Third Replenishment are expressed in terms of “U.S.
dollars of the weight and fineness in effect on January 1, 1960” (1960 dollars). Following the abolition of gold as a
common denominator of the monetary system and the repeal of the provision of the U.S. law defining the par value
of the U.S. dollar in terms of gold, the pre-existing basis for translating 1960 dollars into current dollars or any other
currency disappeared. The Executive Directors of IDA decided, that until such time as the relevant provisions of the
Articles of Agreement are amended, the words “U.S. dollars of the weight and fineness in effect on January 1, 1960”
in Article II, Section 2(b) of the Articles of Agreement of IDA are interpreted to mean the SDR introduced by the
International Monetary Fund as the SDR was valued in terms of U.S. dollars immediately before the introduction of
the basket method of valuing the SDR on July 1, 1974, such value being equal to $1.20635 for one SDR (the 1974
SDR). The Executive Directors also decided to apply the same standard of value to amounts expressed in 1960
dollars in the relevant resolutions of the Board of Governors.
The subscriptions and contributions provided through the Third Replenishment are expressed on the basis of the
1974 SDR. Prior to the decision of the Executive Directors, IDA had valued these subscriptions and contributions on
the basis of the SDR at the current market value of the SDR.
The subscriptions and contributions provided under the Fourth Replenishment and thereafter are expressed in
members’ currencies or SDRs and are payable in members’ currencies. Subscriptions and contributions made
available for disbursement in cash to IDA are translated at market exchange rates in effect on the dates they were
made available. Subscriptions and contributions not yet available for disbursements are translated at market
exchange rates in effect at the end of the reporting period.
Maintenance of Value
Article IV, Section 2(a) and (b) of IDA’s Articles of Agreement provides for maintenance of value payments on
account of the local currency portion of the initial subscription whenever the par value of the member’s currency or
its foreign exchange value has depreciated or appreciated to a significant extent, so long as, and to the extent that,
such currency shall not have been initially disbursed or exchanged for the currency of another member. The
provisions of Article IV, Section 2(a) and (b) have by agreement been extended to cover additional subscriptions
and contributions of IDA through the Third Replenishment, but are not applicable to those of the Fourth and
subsequent replenishments.
The Executive Directors decided on June 30, 1987 that settlements of maintenance of value, which would result
from the resolution of the valuation issue on the basis of the 1974 SDR, would be deferred until the Executive
Directors decide to resume such settlements. These amounts are shown as Deferred Amounts to Maintain Value of
Currency Holdings and deducted from equity; any changes relate solely to translation adjustments.
Nonnegotiable, Noninterest-bearing Demand Obligations on Account of Members’ Subscriptions and
Contributions
Payments on these instruments are due to IDA upon demand and these instruments are held in bank accounts in
IDA’s name. These instruments are carried and reported at face value as a reduction to equity on the Balance Sheet.
Loans and Other Exposures
In fulfilling its mission, IDA makes concessional and non-concessional loans to the poorest countries. These loans
and other exposures (collectively “exposures”) are made to, or guaranteed by, member governments or to the
government of a territory of a member (except for loans which have been made to regional development institutions
for the benefit of members or territories of members of IDA). In order to qualify for lending on IDA terms, a
82 IDA FINANCIAL STATEMENTS: JUNE 30, 2022
country’s per capita income must be below a certain level ($1,205 for the fiscal year ended June 30, 2022 and
$1,185 for the fiscal year ended June 30, 2021) and the country may have only limited or no access to IBRD
lending.
Loans are reported on the balance sheet at amortized cost. Commitment charges on the undisbursed balance of loans
are recognized in revenue as earned. Any loan origination fees incorporated in the terms of a loan are deferred and
recognized over the life of the loan as an adjustment of the yield. Accrued interest is presented on the Balance Sheet
in the line item Other receivables, accrued interest and commitment charges.
It is IDA’s practice not to reschedule service charges, interest or principal payments on its loans or participate in
debt rescheduling agreements with respect to its loans. Should modifications be made to the terms of existing loans,
IDA would perform an evaluation to determine the required accounting treatment, including whether the
modifications would result in the affected loans being accounted for as a trouble debt restructuring, new loan, or as a
continuation of the existing loans.
It is IDA’s policy to place into nonaccrual status all loans and other exposures made to, or guaranteed by, a member
or to the territory of a member if principal or charges with respect to any such loan and other exposures are overdue
by more than six months, unless IDA’s management determines that the overdue amount will be collected in the
immediate future. In addition, if loans by IBRD to a member government are placed into nonaccrual status, all loans
and other exposures to that member will also be placed into nonaccrual status by IDA. On the date a member’s loans
and other exposures are placed into nonaccrual status, unpaid charges that had been accrued on loans are deducted
from loan revenue in the current period.
Interest and other charges on nonaccruing exposures are included in revenue only to the extent that payments have
been received by IDA. A decision on the restoration of accrual status is made upon arrears clearance. If
collectability risk is considered to be particularly high at the time of arrears clearance, the member’s exposures may
not automatically emerge from nonaccrual status until a suitable period of payment or policy performance has
passed.
The repayment obligations of loans funded from resources through the Fifth Replenishment are expressed in the
loan agreements in terms of 1960 dollars. In June 1987, the Executive Directors decided to value those loans at the
rate of $1.20635 per 1960 dollar on a permanent basis. Loans funded from resources provided under the Sixth
Replenishment and thereafter are denominated in SDRs, with the exception of loans provided under the Single
Currency Lending program, which allows IDA recipients to denominate new IDA loans in one of the five
constituent currencies of the SDR basket.
Loan commitments: Undisbursed loans relate to operations approved by the Executive Directors for which
disbursements are yet to be made. IDA records a provision for expected losses on undisbursed loan commitments
including Deferred Drawdown Options (DDOs), when signed by both parties. The signature of the loan agreement is
a binding event that prevents IDA from unconditionally withdrawing from the agreement.
Buy-down of Loans
IDA enters into loan buy-down agreements with third party donors who make payments on the borrower’s service
and commitment charges through a trust fund until the borrower reaches agreed performance goals. The trust fund
then buys down the related loans for an amount equivalent to the present value of the remaining cash flows of the
related loans, ensuring IDA incurs no economic loss. The trust fund subsequently cancels the purchased loans,
converting them to grant terms.
Development Grants
Development grants made by IDA that are deemed to be conditional, are expensed when all the conditions have
been met, which generally occurs at the time of disbursement. At times, grant advances may be disbursed to
recipients prior to the conditions stipulated in the grant agreement being met and are presented in the Other assets
line on the Balance Sheet. Development grants that are deemed to be unconditional are expensed upon approval.
Commitment charges on the undisbursed balance of development grants are recognized in revenue as earned.
Project Preparation Advances
Project Preparation Advances (PPAs) are advances made to borrowers to finance project preparation costs pending
the approval of follow-on development operations. If approved under grant terms, these amounts are expensed upon
IDA FINANCIAL STATEMENTS: JUNE 30, 2022 83
approval by management. To the extent there are follow-on loans or grants, these PPAs are refinanced out of the
proceeds of the loans and grants. Accordingly, the PPA grant amounts initially charged to expense are reversed upon
approval of the follow-on development grants or loans.
Guarantees
Financial guarantees are commitments issued by IDA to guarantee payment performance by a member country (the
debtor) to a third party in the event that a member government (or government-owned entity) fails to perform its
contractual obligations to a third party.
Guarantees are regarded as outstanding when the underlying financial obligation of the borrower is incurred, and
called when a guaranteed party demands payment under the guarantee. IDA would be required to perform under its
guarantees if the payments guaranteed are not made by the borrower and the guaranteed party called the guarantee
by demanding payment from IDA in accordance with the terms of the guarantee.
At inception of the guarantees, IDA records the fair value of the obligation to stand ready and a corresponding
guarantee fee receivable, included in Other Liabilities - Accounts payable and miscellaneous liabilities and in Other
Assets, respectively, on the Balance Sheet. Upfront guarantee fees received are deferred and amortized over the life
of the guarantee.
In the event that a sovereign guarantee is called, IDA has the contractual right to require payment from the member
country.
HIPC Debt Initiative
The Heavily Indebted Poor Countries (HIPC) Debt Initiative was launched in 1996 as a joint effort by bilateral and
multilateral creditors to ensure that reform efforts of HIPCs would not be put at risk by unsustainable external debt
burdens.
Under the Enhanced HIPC Framework, implementation mechanisms include: (i) partial forgiveness of IDA debt
service as it comes due, and ii) in the case of countries with a substantial amount of outstanding IBRD debt, partial
repayment with IDA resources (excluding transfers from IBRD) of outstanding IBRD debt.
Upon signature by IDA of the country specific legal notification, immediately following the decision by the
Executive Directors of IDA to provide debt relief to the country (the Decision Point), the country becomes eligible
for debt relief up to the nominal value equivalent of one third of the net present value of the total HIPC debt relief
committed to the specific country. A Completion Point is reached when the conditions specified in the legal
notification are met and the country’s other creditors have confirmed their full participation in the debt relief
initiative. When the country reaches its Completion Point, IDA’s commitment to provide the total debt relief for
which the country is eligible, becomes irrevocable. IDA’s provisioning policy for the HIPC Debt Initiative is
discussed below.
Donors compensate IDA on a “pay-as-you-go” basis to finance IDA’s forgone loan reflows (principal and service
charge repayments) under the HIPC Debt Initiative. This means that for the debt relief provided by writing off the
principal and charges during a replenishment, the donors compensate IDA for the forgone reflows through
additional contributions in the relevant replenishment. These additional resources are accounted for as equity, as
subscriptions and contributions, because they carry voting rights.
MDRI
Debt relief provided under the Multilateral Debt Relief Initiative (MDRI), which is characterized by the writeoff of
eligible loans upon qualifying borrowers reaching the HIPC Completion Point, is in addition to existing debt relief
commitments provided by IDA and other creditors under the HIPC Debt Initiative. When a country reaches
Completion Point, the applicable loans are written off. This writeoff occurs at the beginning of the quarterly period
following the date on which the country reaches Completion Point. For forgone repayments under MDRI, donors
established a separate MDRI replenishment spanning fiscal years 2007 through 2044 and pledged to compensate
IDA for the costs of providing debt relief under MDRI on a “dollar-for-dollar” basis. These additional resources are
accounted for as equity, as subscriptions and contributions, because they carry voting rights.
Accumulated Provision for Losses on Loans and Other Exposures
Management determines the appropriate level of accumulated provisions for losses on loan exposures, which reflects
the expected losses inherent in IDA’s exposures.
84 IDA FINANCIAL STATEMENTS: JUNE 30, 2022
The accumulated provision for losses on loans and other exposures includes the accumulated provision for HIPC
Debt Initiative and MDRI.
HIPC Debt Initiative and MDRI
The adequacy of the accumulated provision for the HIPC Debt Initiative and MDRI is based on both quantitative
and qualitative analyses of various factors, including estimates of the Decision and the Completion point dates. IDA
periodically reviews these factors and reassesses the adequacy of the accumulated provision for the HIPC Debt
Initiative and MDRI.
Upon approval by the Executive Directors of a country as potentially eligible for IDA debt relief under the
Enhanced HIPC Initiative, the principal component of the estimated debt relief costs is recorded within the
accumulated provision for loan losses on the Balance Sheet, and as a provision expense in the Statement of Income.
This estimate is subject to periodic revision. Adjustments to the accumulated provision are recorded as a charge to or
release of provision in the Statement of Income. The accumulated provision for HIPC Debt Initiative is reduced as
debt relief is provided. The accumulated provision for HIPC Debt Initiative is reduced by the amount of the eligible
loans written off when the country reaches Completion Point and becomes eligible for MDRI debt relief.
Following the Executive Directors' approval of IDA's participation in the MDRI in June 2006, IDA fully provided
for the estimated writeoff of the principal component of debt relief to be delivered under the MDRI for the HIPC
eligible countries confirmed by the Executive Directors as eligible for relief at that time.
Loans
Loan exposures are disaggregated into two groups: exposures in accrual status and exposures in nonaccrual status. In
each group, a credit risk rating is assigned to the exposures for each borrower (defined as the nominal amount of
loans outstanding less the accumulated provision for loss under the HIPC Debt Relief Initiative, and MDRI).
The total exposure for provisioning is the current exposure and the estimated exposure taking into account expected
disbursements and repayments over the life of the instruments. The expected credit losses related to loans and other
exposures are calculated over the life of the instruments based on the expected exposures, the expected default
frequency (probability of default to IDA) and the estimated loss given default. The provision for expected losses is
the sum of the expected annual losses over the life of the instruments.
For countries in accrual status, these exposures are grouped in pools of borrowers with a similar risk rating. The
determination of a borrower’s rating is based on various factors (see Note D—Loans and other exposures). Each
risk rating is mapped to an expected default frequency using IDA’s credit migration matrix, based on historical
observations of credit ratings at the beginning and at the end of each year.
Expected losses on loan exposures comprise estimates of potential losses arising from default and nonpayment of
principal and interest amounts due, and any economic loss due to delays in receiving payments. The estimated loss
given default is determined at each balance sheet date, based on IDA’s historical experience as well as parameters
adjusted for current conditions during the reasonable and supportable forecast period of IDA. The loss given default
is based on the borrower’s eligibility, namely: IDA, Blend (IBRD and IDA) and IBRD, with the highest loss given
default associated with IDA eligibility. The borrower’s eligibility is assessed at least annually. The main factors
used to determine the loss given default are the estimated length of delays in receiving loan payments and the
effective interest rate of the exposures. IDA’s loan portfolio comprises mostly fixed interest rate loans, therefore, the
measurement of loss severity is not sensitive to market interest rate movements.
For the calculation of expected credit losses, IDA applies a three-year reasonable and supportable forecast period
representing the most reliable and available economic data during this period. IDA also applies a ten-year straight-
line reversion to the mean to reflect the historical pattern of rating migration to the mean of its loan portfolio.
This methodology is also applied to countries with exposures in nonaccrual status, although the expected default
frequency is equal to 100%. At times, to reflect certain distinguishing circumstances of a particular nonaccrual
situation, different input assumptions may be used for a specific country.
All exposures for countries in nonaccrual status are individually assessed. Exposure for certain countries in accrual
status may be individually assessed on the basis that they do not share common risk characteristics with an existing
pool of exposures. Except for debt relief provided under the HIPC Debt Initiative and MDRI, it is IDA’s practice not
to write off its loans. To date, no loans have been written off, other than under the HIPC Debt Initiative, MDRI and
buy-down of loans.
IDA FINANCIAL STATEMENTS: JUNE 30, 2022 85
Management reassesses the adequacy of the accumulated provision on a quarterly basis and adjustments to the
accumulated provision are recorded as a charge to or release of provision in the Statement of Income. In addition,
reasonableness of the inputs used is reassessed at least annually.
When a member country prepays its outstanding loans, it may receive a discount equivalent to the difference
between the outstanding carrying amount and the present value of the remaining cash flows. In such instances, IDA
records a provision for losses on loans equivalent to the discount provided, at the time when the prepayment terms
are agreed between IDA and the member country.
Loan Commitments
IDA records the expected credit losses on loan commitments based on the projected disbursements of signed loan
commitments (adjusted by cancellations based on historical experience), the probability of default and loss given
default. The provision is included in Other liabilities - Accounts payable and miscellaneous liabilities on the Balance
Sheet.
Guarantees
IDA records a contingent liability for the expected losses related to guarantees over the projected life of the
instruments, which is determined based on the estimated exposure at default multiplied by the corresponding loss
given default and expected default probability for the projected life of the guarantee. This provision, as well as the
unamortized balance of the deferred guarantee fees, and the unamortized balance of the obligation to stand ready,
are included in Other liabilities - Accounts payable and miscellaneous liabilities on the Balance Sheet.
Statement of Cash Flows: For the purpose of IDA's Statement of Cash Flows, cash is defined as the amount of both
Unrestricted cash and Restricted cash presented under the Due from banks line on the Balance Sheet.
Restricted Cash: This mainly includes amounts which have been received from members as part of their
subscriptions, which are restricted for specified purposes.
Investments
Investment securities are classified based on management’s intention on the date of purchase, their nature, and
IDA’s policies governing the level and use of such investments. All investment securities are held in the trading
portfolio except for a security purchased from IFC in 2015 which is classified as non-trading. While IDA does not
plan to sell the IFC security, IDA elected to measure it at fair value, so that all of its investment securities are
measured on the same basis. All investment securities and related financial instruments held by IDA are carried and
reported at fair value, or at face value which approximates fair value. Where available, quoted market prices are
used to determine the fair value of trading securities. Examples include most government and agency securities,
asset-backed securities (ABS) and mortgage-backed securities (MBS). For instruments for which market quotations
are not available, fair values are determined using model-based valuation techniques, whether internally generated
or vendor-supplied, that include the standard discounted cash flow method using observable market inputs such as
yield curves, credit spreads, and constant prepayment rates. Where applicable, unobservable inputs such as constant
prepayment rates, probability of default and loss severity are used. Unless quoted prices are available, time deposits
are reported at face value, which approximates fair value, as they are short term in nature. Purchases and sales of
securities are recorded on a trade-date basis. Time deposits and money market deposits are recorded at settlement.
The first-in first-out method is used to determine the cost of securities sold in computing the realized gains and
losses on these instruments.
Interest revenue is included in the Investments, net line in the Statement of Income. Unrealized mark-to-market
gains and losses for investment securities and related financial instruments held in the investment portfolio are
included in the Statement of Income. Realized gains and losses on trading securities are recognized in the Statement
of Income when securities are sold.
IDA may require collateral in the form of cash or approved liquid securities from individual counterparties under
legal agreements that provide for collateralization, in order to mitigate its credit exposure to these counterparties.
For collateral received in the form of cash from counterparties, IDA invests the amounts received and records the
investment and a corresponding obligation to return the cash. Collateral received in the form of liquid securities is
only recorded on IDA’s Balance Sheet to the extent that it has been transferred under securities lending agreements
in return for cash.

86 IDA FINANCIAL STATEMENTS: JUNE 30, 2022
Securities Purchased Under Resale Agreements, Securities Sold Under Repurchase Agreements, Securities
Lent Under Securities Lending Agreements and Payable for Cash Collateral Received
Securities purchased under resale agreements, securities sold under repurchase agreements, securities lent under
securities lending agreements and payable for cash collateral received are recorded at face value, which
approximates fair value, as they are short term in nature. IDA receives securities purchased under resale agreements,
monitors the fair value of the securities and, if necessary, closes out transactions and enters into new repriced
transactions. The securities transferred to counterparties under the repurchase and security lending arrangements and
the securities transferred to IDA under the resale agreements have not met the accounting criteria for treatment as a
sale. Therefore, securities transferred under repurchase agreements and security lending arrangements are retained as
assets on the Balance Sheet, and securities received under resale agreements are not recorded on the Balance Sheet.
Securities lent under securities lending agreements and sold under securities repurchase agreements as well as
securities purchased under resale agreements are presented on a gross basis, which is consistent with the manner in
which these instruments are settled. The interest earned with respect to securities purchased under resale agreements
is included in Investments, net, line in the Statement of Income. The interest expense pertaining to the securities sold
under repurchase agreements and security lending arrangements is included in the Borrowing expenses, net line in
the Statement of Income.
Borrowings
IDA introduced long term borrowings through CPL for the first time in the fiscal year commencing July 1, 2014.
The borrowing terms of the CPL aim to match the features of IDA’s concessional loans. These borrowings are
unsecured and unsubordinated debt in SDR component currencies. IDA may prepay some or the entire outstanding
amounts without penalty. These borrowings are carried and reported at amortized cost.
IDA also issues debt instruments in the capital markets. Through June 30, 2021, all market debt was carried at fair
value. Starting July 1, 2021, IDA only elects fair value for market debt designated to fund the investment portfolio
or variable rate loans. Market debt not meeting the fair value election criteria are reported at amortized cost. For debt
carried at fair value, changes in fair value are recognized in the related Unrealized mark-to-market gains and losses
on non-trading portfolios, net, line in the Statement of Income, except for changes in the fair value that relate to
IDA’s own credit risk, which are reported in Other Comprehensive Income (OCI) as a Debit Valuation Adjustment
(DVA). The DVA on fair value option elected liabilities is measured by revaluing each liability to determine the
changes in fair value of that liability arising from changes in IDA’s cost of funding relative to the applicable
reference rates.
Plain vanilla bonds and discount notes, if any, are valued using the standard discounted cash flow method which
relies on observable market inputs such as yield curves, foreign exchange rates, basis spreads and funding spreads.
Where available, quoted market prices are used to determine the fair value of short-term notes.
For the purpose of the Statement of Cash Flows, short term borrowings, if any, with an original maturity of less than
90 days, are presented net of new issuances and retirements. In contrast, short term borrowings with an original
maturity greater than 90 days and less than one year are presented on a gross basis.
Interest expense relating to all debt instruments in IDA’s borrowing portfolio is measured on an effective yield basis
and is reported as part of the Borrowing expenses, net line in the Statement of Income.
For presentation purposes, amortization of discounts and premiums is also included in the Borrowing expenses, net
line in the Statement of Income.
Accounting for Derivatives
IDA has elected not to designate any hedging relationships for accounting purposes. Rather, all derivative
instruments are recorded at fair value on the Balance Sheet, with changes in fair value accounted for through the
Statement of Income.
The presentation of derivative instruments on IDA’s Balance Sheet reflects the netting of derivative asset and
liability positions and the related cash collateral received from the counterparty when a legally enforceable master
netting agreement exists, and the other conditions set out in ASC Topic 210-20, Balance Sheet—Offsetting, are met.
In addition, in the Notes to the financial statements, unless stated differently, derivatives are presented on a net basis
by instrument.
IDA FINANCIAL STATEMENTS: JUNE 30, 2022 87
A master netting agreement is an industry standard agreement with a counterparty that permits multiple transactions
governed by that agreement to be terminated or accelerated and settled through a single payment in a single currency
in the event of a default (e.g., bankruptcy, failure to make a required payment or transfer securities or deliver
collateral when due). Obligations under master netting agreements are often secured by collateral posted under an
industry standard credit support annex to the master netting agreement. Upon default by the counterparty, the
collateral agreement grants an entity the right to set-off any amounts payable by the counterparty against any posted
collateral.
IDA uses derivative instruments in its investment trading portfolio to manage interest rate and currency risks. These
derivatives are carried and reported at fair value. Interest revenue (expenses) are reflected as part of Interest revenue,
while unrealized mark-to-market gains and losses on these derivatives are reflected as part of the Unrealized mark-
to-market gains (losses) on Investments-Trading portfolio, net line in the Statement of Income.
IDA also uses derivatives in its loan, asset-liability management and borrowing portfolios. Within the asset-liability
management portfolio, currency forward contracts are used to manage foreign exchange fluctuation risks and
interest rate swap contracts under the Capital Value Protection program are used to manage interest rate volatility of
IDA’s capital adequacy model. In the loan and borrowing portfolios, interest rate swaps are used to modify the
interest rate characteristics of these portfolios. The interest component of these derivatives is recognized as an
adjustment to the loan revenue and borrowing costs over the life of the derivative contracts and is included in Loans,
net and Borrowing expenses, net lines in the Statement of Income. Changes in fair values of these derivatives are
recorded in the Statement of Income as Unrealized mark-to-market gains and losses on non-trading portfolios, net.
For the purpose of the Statement of Cash Flows, IDA has elected to report the cash flows associated with the
derivative instruments that are used to economically hedge its borrowings and investments, in a manner consistent
with the presentation of the related borrowing and investment cash flows.
Derivative contracts include currency forward contracts, TBA securities, swaptions, exchange traded options and
futures contracts, currency swaps and interest rate swaps. Currency swaps and interest rate swaps are primarily plain
vanilla instruments and they are valued based on standard discounted cash flow methods using observable market
inputs such as yield curves, foreign exchange rates, basis spreads and funding spreads.
Most outstanding derivative positions are transacted over-the-counter and are therefore valued using internally
developed valuation models. For commercial and non-commercial counterparties where IDA is in a net receivable
position, IDA calculates a Credit Valuation Adjustment (CVA) to reflect credit risk. For net derivative positions
with commercial and non-commercial counterparties where IDA is in a net payable position, IDA calculates a DVA
to reflect its own credit risk. The CVA is calculated using the fair value of the derivative contracts, net of collateral
received under credit support agreements, and the probability of counterparty default based on the Credit Default
Swap (CDS) spread and, where applicable, proxy CDS spreads. The DVA calculation is generally consistent with
the CVA methodology and incorporates IDA’s own credit spread as observed through the CDS market.
Valuation of Financial Instruments
IDA has an established and documented process for determining fair values. Fair value is based upon quoted market
prices for the same or similar securities, where available.
Financial instruments for which quoted market prices are not readily available are valued based on discounted cash
flow models and other established valuation models. These models primarily use market-based or independently
sourced market parameters such as yield curves, interest rates, volatilities, foreign exchange rates and credit curves,
and may incorporate unobservable inputs. Selection of these inputs may involve some judgment. In instances where
management relies on instrument valuations supplied by external pricing vendors, there are procedures in place to
validate the appropriateness of the models used as well as the inputs applied in determining those values.
IDA also has various internal controls in place to ensure that the valuations are appropriate where internally
developed models are used.
As of June 30, 2022 and June 30, 2021, IDA had no financial assets or liabilities measured at fair value on a non-
recurring basis.
Fair Value Hierarchy
Financial instruments are categorized based on the priority of the inputs to the valuation technique. The fair value
hierarchy gives the highest priority to quoted prices in active markets for identical assets or liabilities (Level 1), the
88 IDA FINANCIAL STATEMENTS: JUNE 30, 2022
next highest priority to observable market-based inputs or inputs that are corroborated by market data (Level 2) and
the lowest priority to unobservable inputs that are not corroborated by market data (Level 3).
Financial assets and liabilities recorded at fair value on the Balance Sheet are categorized based on the inputs to the
valuation techniques as follows:
Level 1: Financial assets and liabilities whose values are based on unadjusted quoted prices for identical assets or
liabilities in active markets.
Level 2: Financial assets and liabilities whose values are based on quoted prices for similar assets or liabilities in
active markets; quoted prices for identical or similar assets or liabilities in non-active markets; or pricing
models for which all significant inputs are observable, either directly or indirectly for substantially the full
term of the asset or liability.
Level 3: Financial assets and liabilities whose values are based on prices or valuation techniques that require inputs
that are both unobservable and significant to the overall fair value measurement.
IDA’s policy is to recognize transfers in and transfers out of levels as of the end of the reporting period in which
they occur.
Accounting for Contributions to Special Programs
IDA recognizes unconditional grants such as contributions to special programs as an expense upon approval by the
Executive Directors.
Transfers
Transfers from IBRD’s net income to IDA are recognized in the Statement of Income upon approval by the Board of
Governors of IBRD. Similarly, transfers relating to grants made from IFC’s retained earnings to IDA are recognized
in the Transfers from affiliated organizations and others on the Statement of Income and Other assets on the Balance
Sheet upon execution of a grant agreement between IFC and IDA.
In addition, IDA periodically receives contributions from trust funds and private institutions. IDA does not assign
any voting rights for these contributions. Temporary restrictions relating to these contributions may arise from the
timing of receipt of cash, or donor imposed restrictions as to use.
Trust Funds
To the extent that IDA acts as an agent for or controls IDA-executed trust funds, assets held on behalf of specified
beneficiaries are recorded on IDA’s Balance Sheet, along with corresponding liabilities. Amounts disbursed from
these trust funds are recorded as expenses with the corresponding amounts recognized as revenue. For Recipient-
executed trust funds, since IDA acts as a trustee, no assets or liabilities relating to these activities are recorded on the
Balance Sheet.
In some trust funds, execution is split between Recipient-executed and IDA-executed portions. Decisions on
assignment of funding resources between the two types of execution may be made on an ongoing basis; therefore,
the execution of a portion of these available resources may not yet be assigned.
IDA also acts as a financial intermediary to provide specific administrative or financial services with a limited
fiduciary or operational role. These arrangements, referred to as Financial Intermediary Funds, include, for example,
administration of debt service trust funds, financial intermediation and other more specialized limited fund
management roles. For these arrangements, funds are held and disbursed in accordance with instructions from
donors or, in some cases, an external governance structure or a body operating on behalf of donors. For Financial
Intermediary Funds, since IDA acts as a trustee, no assets or liabilities relating to these activities are recorded on
IDA’s Balance Sheet.
Segment Reporting
Based on an evaluation of its operations, management has determined that IDA has only one reportable segment
since financial results are reviewed and resource allocation decisions are made at the entity level.

IDA FINANCIAL STATEMENTS: JUNE 30, 2022 89
Accounting and Reporting Developments
Evaluated Accounting Standards:
In June 2016, the Financial Accounting Standards Board (FASB) issued ASU 2016-13, Financial Instruments –
Credit Losses (Topic 326): Measurement of Credit Losses on Financial Instruments (CECL ASU). The ASU and its
subsequent amendments introduce a new model for the accounting of credit losses of loans and other financial assets
measured at amortized cost. The current expected credit loss (CECL) model requires an entity to estimate the credit
losses expected over the life of an exposure, considering historical information, current information, and reasonable
and supportable forecasts. Additionally, the ASUs require enhanced disclosures about credit quality and significant
estimates and judgments used in estimating credit losses.
For IDA, the ASUs became effective on July 1, 2020. The transition adjustment increased the Accumulated
Deficit by $802 million, which reflects the increase in the credit losses relating to loans and other exposures under
CECL compared to the previous “incurred loss” model. The impact is mainly driven by the requirement to provision
over the full life of IDA’s long maturity profile credit exposures as well as the inclusion of signed loan
commitments in the determination of the provision.
See the table below for details of the CECL transition adjustment as of July 1, 2020. The transition adjustment had
no impact to the Statement of Income. See Note D — Loans and Other Exposures, for additional details.
In millions of U.S. dollars
Accumulated provision related to
Location on the Balance Sheet
June 30, 2020
As reported
Impact of the
adoption of the
CECL ASU
July 1, 2020
Adjusted
Loans outstanding
Accumulated provision for loan
losses
$
2,829
$
(59)
$
2,770
Debt Relief under HIPC/MDRI
Accumulated provision for loan
losses
1,591
-
1,591
Signed loan commitments
Other liabilities
-
859
859
Other exposures
Other liabilities
72
2
74
Total accumulated provision
$
4,492
$
802
$
5,294
Accumulated Deficit
$
(58,321)
$
(802)
$
(59,123)
Accounting Standards Under Evaluation:
In March 2022, the FASB issued the Accounting Standard Update (ASU) 2022-02, Troubled Debt Restructurings
and Vintage Disclosures, which eliminates the accounting guidance on troubled debt restructurings (TDRs) for
creditors and amends the guidance on “vintage disclosures” to require disclosure of current-period gross writeoffs by
year of origination. For IDA, the ASU will be effective from the quarter ending September 30, 2023 (fiscal year
2024), with early adoption permitted. IDA is currently evaluating the impact of the ASU on its financial statements.
In November 2021, the FASB issued the ASU 2021-10, Disclosure by Business Entities about Government
Assistance, which requires entities to make annual disclosure about certain government assistance they received.
This ASU will be effective from the fiscal year ending June 30, 2023 (annual statements of fiscal year 2023), with
early adoption permitted. IDA is currently evaluating the impact of the ASU on its financial statements.

90 IDA FINANCIAL STATEMENTS: JUNE 30, 2022
NOTE B—MEMBERS’ SUBSCRIPTIONS AND CONTRIBUTIONS, AND MEMBERSHIP
The movement in subscriptions and contributions paid-in is summarized below:
Table B1: Subscriptions and contributions paid-in
In millions of U.S. dollars
June 30, 2022
June 30, 2021
Beginning of the fiscal year
$
250,452
$
241,343
Cash contributions received
a
3,937
3,442
Demand obligations received
4,668
4,901
Translation adjustment
(1,280)
766
End of the fiscal year
$
257,777
$
250,452
a. Includes any restricted cash subscriptions.
During the fiscal year ended June 30, 2022, IDA encashed demand obligations totaling $4,652 million ($4,913
million—fiscal year ended June 30, 2021).
Membership
On November 3, 2021, Bulgaria became the 174
th
member of IDA.
NOTE C—INVESTMENTS
The investment securities held by IDA are designated as either trading or non-trading. All securities are reported at
fair value, or at face value which approximates fair value.
As of June 30, 2022, IDA’s Investments were mainly comprised of government and agency obligations (60%), with
all the instruments being classified as either Level 1 or Level 2 within the fair value hierarchy. As of June 30, 2022,
the largest holding of investments with a single counterparty was Japanese government instruments (8%).
A summary of IDA’s investments composition is as follows:
Table C1: Investments-composition
In millions of U.S. dollars
June 30, 2022
June 30, 2021
Trading
Government and agency obligations
$
23,902
$
25,277
Time deposits
15,411
11,460
Asset-backed securities
168
152
$
39,481
$
36,889
Non-trading
Debt securities
346
487
Total
$
39,827
$
37,376

IDA FINANCIAL STATEMENTS: JUNE 30, 2022 91
IDA manages its investments on a net portfolio basis. The following table summarizes IDA’s net portfolio position;
the presentation of derivative instruments is on a net instrument basis:
Table C2: Net investment portfolio position
In millions of U.S. dollars
June 30, 2022
June 30, 2021
Investments
Trading
$
39,481
$
36,889
Non-trading
346
487
Total
39,827
37,376
Securities sold under repurchase agreements, securities lent
under securities lending agreements, and payable for cash
collateral received
a
(772)
-
Derivative Assets
Currency swaps and currency forward contracts
306
167
Interest rate swaps
2
-
Total
308
167
Derivative Liabilities
Currency swaps and currency forward contracts
(50)
(65)
Interest rate swaps
(1)
(17)
Total
(51)
(82)
Cash held in investment portfolio
b
583
426
Receivable from investment securities traded and other assets
c
9
107
Payable for investment securities purchased
d
(343)
(73)
Net Investment Portfolio
$
39,561
$
37,921
a. As of June 30, 2022, this amount represents cash collateral of $772 million received from counterparties under derivative
agreements (Nil - June 30, 2021).
b. This amount is included in Unrestricted cash under Due from Banks on the Balance Sheet.
c. This amount is included in Other receivables and in Other assets, respectively, on the Balance Sheet.
d. As of June 30, 2022, there were no short sales (Nil —June 30, 2021)

92 IDA FINANCIAL STATEMENTS: JUNE 30, 2022
IDA uses derivative instruments to manage currency and interest rate risk in the investment portfolio. For details
regarding these instruments, see Note F—Derivative Instruments.
The maturity structure of IDA’s non-trading investment portfolio (principal amount due) is provided in the table
below:
Table C3: Maturity structure of non-trading investment portfolio
In millions of U.S. dollars
Period
June 30, 2022
June 30, 2021
Less than 1 year
$
96
$
113
Between
1 - 2 years
77
96
2 - 3 years
62
77
3 - 4 years
34
62
4 - 5 years
12
34
Thereafter
77
90
$
358
$
472
Commercial Credit Risk
For the purpose of risk management, IDA is party to a variety of financial transactions, certain of which involve
elements of credit risk. Credit risk exposure represents the maximum potential loss due to possible nonperformance
by obligors and counterparties under the terms of the contracts. For all securities, IDA limits trading to a list of
authorized dealers and counterparties. In addition, credit limits have been established for counterparties by type of
instrument and maturity category.
Swap Agreements: Credit risk is mitigated through a credit approval process, volume limits, monitoring procedures
and the use of mark-to-market collateral arrangements. IDA may require collateral in the form of cash or other
approved liquid securities from individual counterparties to mitigate its credit exposure.
IDA has entered into master derivative agreements, which contain legally enforceable close-out netting provisions.
These agreements may further reduce the gross credit risk exposure related to the swaps. Credit risk with financial
assets subject to a master derivative arrangement is further reduced under these agreements to the extent that
payments and receipts with the counterparty are netted at settlement. The reduction in exposure as a result of these
netting provisions can vary due to the impact of changes in market conditions on existing and new transactions. The
extent of the reduction in exposure may therefore change substantially within a short period of time following the
balance sheet date. For more information on netting and offsetting provisions, see Note F—Derivative Instruments.
The following table is a summary of the collateral received by IDA related to swap transactions:
Table C4: Collateral received
In millions of U.S. dollars
June 30, 2022
June 30, 2021
Collateral received
Cash
$
772
$
-
Securities
-
-
Total collateral received
$
772
$
-
Collateral permitted to be repledged
$
772
$
-
Amount of collateral repledged
-
-
Amount of cash collateral invested
659
-
Securities Lending: IDA may engage in securities lending and repurchases, against adequate collateral, as well as
securities borrowing and reverse repurchases (resales) of government and agency obligations, and ABS.
These transactions, if any, are conducted under legally enforceable master netting arrangements, which allow IDA to
reduce its gross credit exposure related to these transactions.

IDA FINANCIAL STATEMENTS: JUNE 30, 2022 93
Transfers of securities by IDA to counterparties are not accounted for as sales as the accounting criteria for the
treatment as a sale have not been met. Counterparties are permitted to repledge these securities until the repurchase
date.
Securities lending agreements and repurchase agreements expose IDA to several risks, including counterparty risk,
reinvestment risk, and risk of a collateral gap (increase or decrease in the fair value of collateral pledged). IDA has
procedures in place to ensure that trading activity and balances under these agreements are below predefined
counterparty and maturity limits, and to actively monitor net counterparty exposure, after collateral, through daily
mark-to-market. Whenever the collateral pledged by IDA related to its borrowings under securities lending
agreements and repurchase agreements declines in value, the transaction is re-priced as appropriate by returning
cash or pledging additional collateral.
NOTE D—LOANS AND OTHER EXPOSURES
IDA’s loans and other exposures are generally made to, or guaranteed by, member countries of IDA. Loans are
reported at amortized cost on the balance sheet. Based on IDA’s internal credit quality indicators, the majority of the
loans outstanding are in the Medium and High risk classes.
IDA excludes the interest and service charges receivable balance from the amortized cost basis and the related
disclosures as permitted by U.S. GAAP. As of June 30, 2022, accrued interest income and service charges on loans
of $521 million ($502 million — June 30, 2021) are presented in Other receivables – Accrued interest and
commitment charges on the Balance Sheet.
As of June 30, 2022, 0.5% of IDA’s loans were in nonaccrual status and related to three borrowers. The total
accumulated provision for losses on loans in accrual status and nonaccrual status was 2% of total loans as of June
30, 2022.
Maturity Structure
The maturity structure of loans outstanding was as follows:
Table D1: Loans - Maturity structure
In millions of U.S. dollars
June 30, 2022
June 30, 2021
July 1, 2022 through June 30, 2023
$
8,280
July 1, 2021 through June 30, 2022
$
7,415
July 1, 2023 through June 30, 2027
36,219
July 1, 2022 through June 30, 2026
36,318
July 1, 2027 through June 30, 2037
78,617
July 1, 2026 through June 30, 2036
80,892
Thereafter
54,975
Thereafter
56,879
Total
$
178,091
Total
$
181,504

94 IDA FINANCIAL STATEMENTS: JUNE 30, 2022
Currency Composition
Loans outstanding had the following currency composition:
Table D2: Loans outstanding- Currency composition
In millions of U.S. dollars
June 30, 2022
June 30, 2021
SDR
$
156,527
$
163,964
U.S. dollar
12,600
10,123
Euro
8,823
7,407
Pound sterling
77
-
Japanese yen
64
10
Total
$
178,091
$
181,504
Credit Quality of Sovereign Loans
Based on an evaluation of IDA’s exposures, management has determined that IDA has one portfolio segment –
Sovereign Exposures. IDA’s loans constitute the majority of the Sovereign Exposures portfolio segment.
IDA’s country risk ratings are an assessment of its borrowers’ ability and willingness to repay IDA on time and in
full. These ratings are internal credit quality indicators. Individual country risk ratings are derived on the basis of
both quantitative and qualitative analyses. The components considered in the analysis can be grouped broadly into
eight categories: political risk, external debt and liquidity, fiscal policy and public debt burden, balance of payments
risks, economic structure and growth prospects, monetary and exchange rate policy, financial sector risks, and
corporate sector debt and vulnerabilities. The analysis also takes into account Environmental, Social and
Governance factors. For the purpose of analyzing the risk characteristics of IDA’s exposures, these exposures are
grouped into three classes in accordance with assigned borrower risk ratings, which relate to the likelihood of loss:
Low, Medium and High risk classes, as well as exposures in nonaccrual status.
IDA’s borrower country risk ratings are key determinants in the provision for loan losses. Country risk ratings are
grouped in pools of borrowers with similar credit ratings for the purpose of the calculation of the expected credit
losses. Country risk ratings are determined in review meetings that take place several times a year. All countries are
reviewed at least once a year, or more frequently if circumstances warrant, to determine the appropriate ratings.
An assessment was also performed to determine whether a qualitative adjustment of the loan loss provision was
needed as of June 30, 2022, including consideration of the COVID-19 pandemic and other global events.
Management concluded that a qualitative adjustment beyond the regular application of IDA’s loan loss provision
framework was not warranted.
IDA considers loans to be past due when a borrower fails to make payment on any principal, interest or other
charges due to IDA on the dates provided in the contractual loan agreement.
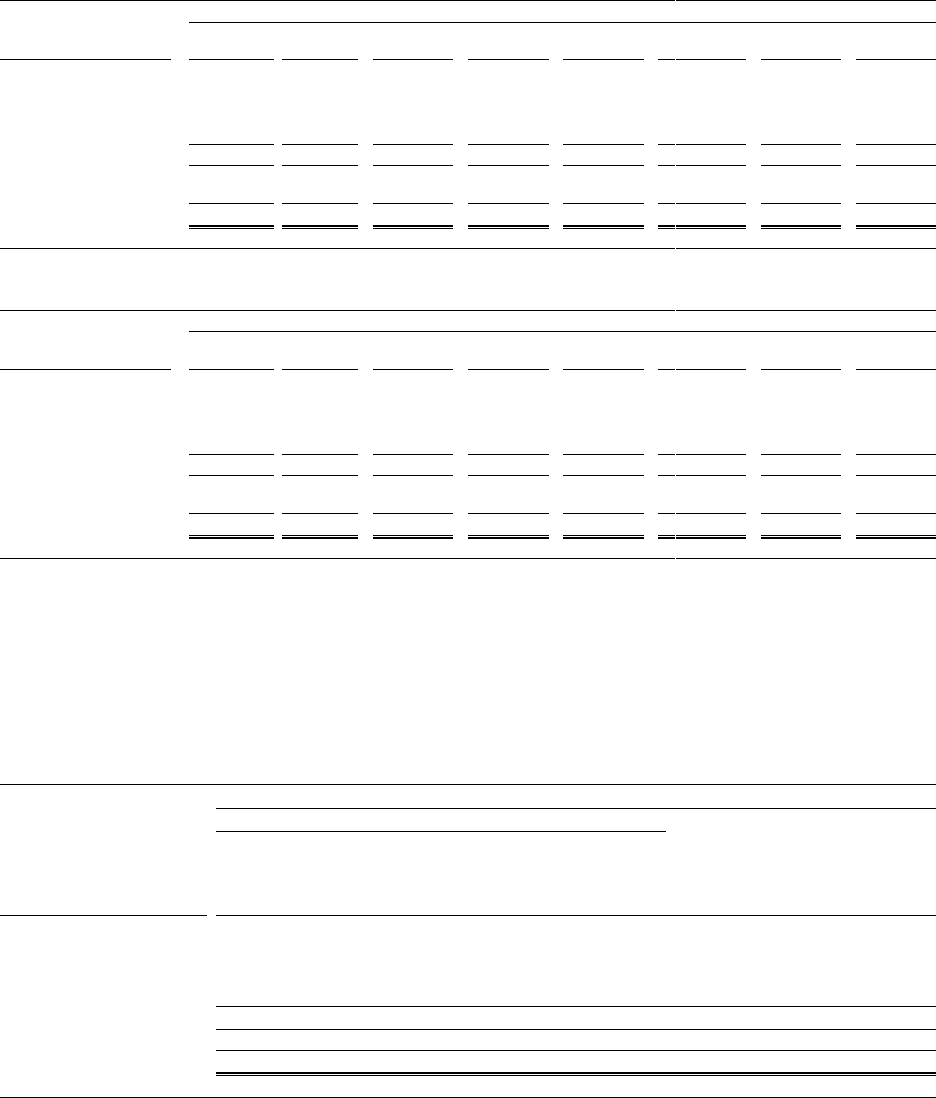
IDA FINANCIAL STATEMENTS: JUNE 30, 2022 95
The following tables provide an aging analysis of loans outstanding:
Table D3: Loans-Aging structure
In millions of U.S. dollars
June 30, 2022
Days past due
Up to 45
46-60
61-90
91-180
Over 180
Total Past
Due
Current
Total
Risk Class
Low
$
-
$
-
$
-
$
-
$
-
$
-
$
374
$
374
Medium
-
-
-
-
-
-
20,491
20,491
High
7
*
6
11
-
24
156,335
a
156,359
Loans in accrual status
7
*
6
11
-
24
177,200
177,224
Loans in nonaccrual
status
7
*
3
8
408
426
441
867
Total
$
14
$
*
$
9
$
19
$
408
$
450
$
177,641
$
178,091
Table D3.1
In millions of U.S. dollars
June 30, 2021
Days past due
Up to 45
46-60
61-90
91-180
Over 180
Total Past
Due
Current
Total
Risk Class
Low
$
-
$
-
$
-
$
-
$
-
$
-
$
659
$
659
Medium
-
-
-
-
-
-
23,092
23,092
High
7
-
-
-
-
7
156,814
a
156,821
Loans in accrual status
7
-
-
-
-
7
180,565
180,572
Loans in nonaccrual
status
7
1
3
9
399
419
513
932
Total
$
14
$
1
$
3
$
9
$
399
$
426
$
181,078
$
181,504
a. Includes PSW-related loans of $50 million ($10 million-June 30, 2021)
* Indicates amount less than $0.5 million.
The table below discloses the outstanding balances of IDA’s loan portfolio classified by the year the loan agreement
was signed. IDA considers the signature date of a loan as the best indicator of the decision point in the origination
process, rather than the disbursement date.
Table D4: Loan portfolio vintage disclosure
In millions of U.S. dollars
June 30, 2022
Fiscal Year of origination
CAT DDOs
disbursed
and
revolving
CAT DDOs
Converted
to Term
Loans
Loans
Outstanding
as of June
30, 2022
Risk Class
2022
2021
2020
2019
2018
Prior
Years
Low
$
-
$
-
$
-
$
-
$
-
$
374
$
-
$
-
$
374
Medium
111
394
542
243
77
19,124
-
-
20,491
High
3,678
7,509
7,233
9,365
10,042
118,173
182
177
156,359
Loans in accrual status
3,789
7,903
7,775
9,608
10,119
137,671
182
177
177,224
Loans in nonaccrual status
-
-
-
-
-
867
-
-
867
Total
$
3,789
$
7,903
$
7,775
$
9,608
$
10,119
$
138,538
$
182
$
177
$
178,091

96 IDA FINANCIAL STATEMENTS: JUNE 30, 2022
Table D4.1:
In millions of U.S. dollars
June 30, 2021
Fiscal Year of origination
CAT DDOs
disbursed
and
revolving
CAT DDOs
Converted
to Term
Loans
Loans
Outstanding
as of June
30, 2021
Risk Class
2021
2020
2019
2018
2017
Prior
Years
Low
$
-
$
-
$
-
$
-
$
-
$
659
$
-
$
-
$
659
Medium
401
564
255
64
488
21,320
-
-
23,092
High
4,803
6,260
8,266
8,861
8,927
119,316
388
-
156,821
Loans in accrual status
5,204
6,824
8,521
8,925
9,415
141,295
388
-
180,572
Loans in nonaccrual status
-
-
-
-
-
932
-
-
932
Total
$
5,204
$
6,824
$
8,521
$
8,925
$
9,415
$
142,227
$
388
$
-
$
181,504
The amount of Catastrophe Deferred Drawdown Option (CAT DDO) outstanding and revolving converted to term
loans during the fiscal year ended June 30, 2022 was $177 million (Nil— June 30, 2021).
Accumulated Provision for Losses on Loans and Other Exposures
Management determines the appropriate level of accumulated provisions for losses, which reflects the expected
losses inherent in IDA’s exposures.
The provision for HIPC Debt Initiative and MDRI is based on quantitative and qualitative analyses of various
factors, including estimates of Decision Point and Completion Point dates. These factors are reviewed periodically
as part of the reassessment of the adequacy of the accumulated provision for loan losses. Provisions are released as
qualifying debt service becomes due and is forgiven under the HIPC Debt Initiative and are reduced by the amount
of the eligible loans written off when the country reaches Completion Point and becomes eligible for MDRI debt
relief.
The balance of the accumulated provision as of July 1, 2020 was increased by an $802 million transition adjustment
recorded upon the adoption of ASU No. 2016-13, Financial Instruments—Credit Losses (ASC 326). The transition
adjustment corresponds to the difference between the accumulated provision calculated under the previous “incurred
loss” model and the current expected credit loss model. Changes to the accumulated provision for losses on loans
and other exposures are summarized below.

IDA FINANCIAL STATEMENTS: JUNE 30, 2022 97
Table D5: Accumulated provisions
In millions of U.S. dollars
June 30, 2022
Loans
outstanding
Loan
commitments
Debt relief
under
HIPC/MDRI
Other
a
Total
Accumulated provision, beginning of the fiscal year
$
2,946
$
1,054
$
772
$
120
$
4,892
Provision, net - charge (release)
135
109
(5)
39
278
Loans written off under:
HIPC/MDRI
-
-
(30)
b
-
(30)
Translation adjustment
(205)
(81)
(30)
(4)
(320)
Accumulated provision, end of the fiscal year
$
2,876
$
1,082
$
707
$
155
$
4,820
Including accumulated provision for losses on:
Loans in accrual status
$
2,641
$
433
$
3,074
Loans in nonaccrual status
235
274
509
Total
$
2,876
$
707
$
3,583
Loans:
Loans in accrual status
$
177,224
Loans in nonaccrual status
867
Loans outstanding
$
178,091
Table D5.1:
In millions of U.S. dollars
June 30, 2021
Loans
outstanding
Loan
commitments
Debt relief
under
HIPC/MDRI
Other
a
Total
Accumulated provision, beginning of the fiscal year
$
2,829
$
-
$
1,591
$
72
$
4,492
CECL transition adjustment
(59)
859
-
2
802
Adjusted accumulated provision at the beginning
of the fiscal year
2,770
859
1,591
74
5,294
Provision, net - charge (release)
77
166
(828)
46
(539)
Loans written off under:
HIPC/MDRI
-
-
(9)
b
-
(9)
Translation adjustment
99
29
18
-
146
Accumulated provision, end of the fiscal year
$
2,946
$
1,054
$
772
$
120
$
4,892
Including accumulated provision for losses on:
Loans in accrual status
$
2,692
$
485
$
3,177
Loans in nonaccrual status
254
287
541
Total
$
2,946
$
772
$
3,718
Loans:
Loans in accrual status
$
180,572
Loans in nonaccrual status
932
Loans outstanding
$
181,504
a. These amounts primarily relate to outstanding guarantees
b. Represents debt service reduction under HIPC

98 IDA FINANCIAL STATEMENTS: JUNE 30, 2022
Reported as
Balance Sheet
Statement of Income
Accumulated Provision for
Losses on:
Loans Outstanding
Accumulated provision for loan losses
Provision for losses on loans and other
exposures, release (charge)
Debt Relief under
HIPC/MDRI
Accumulated provision for loan losses
Provision for losses on loans and other
exposures, release (charge)
Loan commitments and Other
Exposures
Other liabilities
Provision for losses on loans and other
exposures, release (charge)
Loans to be written off under MDRI
During the fiscal years ended June 30, 2022 and June 30, 2021, there were no loans written off under the MDRI.
Overdue Amounts
IDA considers loans to be past due when a borrower fails to make payment on any principal, service charges or
interest due to IDA on the dates provided in the contractual loan agreement. As of June 30, 2022, principal of $11
million and charges of $4 million payable to IDA from one borrower in accrual status were overdue by more than
three months. These overdue installments have been subsequently received.
During the fiscal year ended June 30, 2021, Sudan paid all of their overdue principal and charges due to IDA. The
outstanding loans remaining to Sudan were restored to accrual status having met conditions in accordance with
IDA’s policy.
The following tables provide a summary of selected financial information for loans in nonaccrual status:
Table D6: Loans in nonaccrual status
In millions of U.S. dollars
Overdue amounts
Borrower
Nonaccrual
since
Recorded
investment
a
Average
recorded
investment
Principal
Outstanding
Provision
for debt
relief
Provision
for loan
losses
b
Principal
Charges
Eritrea
March 2012
$
415
$
434
$
415
$
274
$
15
$
111
$
34
Syrian Arab
Republic
June 2012
14
14
14
-
1
13
1
Zimbabwe
October 2000
438
459
438
-
219
302
66
Total - June 30, 2022
$
867
$
907
$
867
$
274
$
235
$
426
$
101
Total - June 30, 2021
$
932
$
932
$
932
$
287
$
254
$
419
$
102
a. A loan loss provision has been recorded against each of the loans in nonaccrual status.
b. Loan loss provisions are determined after taking into account accumulated provision for debt relief.
During the fiscal years ended June 30, 2022 and June 30, 2021, no new loans were placed into nonaccrual status.

IDA FINANCIAL STATEMENTS: JUNE 30, 2022 99
Table D7: Service charge revenue not recognized
In millions of U.S. dollars
Fiscal Year Ended June 30,
2022
2021
2020
Service charge revenue not recognized as a result of loans
being in nonaccrual status
$
7
$
7
$
15
During the fiscal year ended June 30, 2022, service charge revenue recognized on loans in nonaccrual status was
less than $1 million (Nil—fiscal year ended June 30, 2021 and less than $1 million—fiscal year ended June 30,
2020).
Guarantees
Guarantees of $2,507 million were outstanding as of June 30, 2022 ($2,513 million – June 30, 2021). This amount
includes $638 million relating to the PSW ($484 million—June 30, 2021). The outstanding amount of guarantees
represent the maximum potential undiscounted future payments that IDA could be required to make under these
guarantees that is not included on the Balance Sheet. The guarantees issued by IDA have original maturities ranging
between 3 and 22 years, and expire in decreasing amounts through 2043.
As of June 30, 2022, liabilities related to IDA’s obligations under guarantees included the obligation to stand ready
of $145 million ($138 million— June 30, 2021), and the accumulated provision for guarantee losses of $126 million
($109 million— June 30, 2021). These have been included in Other liabilities on the Balance Sheet.
During the fiscal years ended June 30, 2022 and June 30, 2021, no guarantees provided by IDA to sovereign or sub-
sovereign borrowers were called. During the year ended June 30, 2022, less than $0.5 million of IDA-PSW Blended
Finance Facility guarantees under the Small Loan Guarantee Program pursuant to the risk-sharing agreement
between IDA and IFC were called (less than $0.5 million—fiscal year ended June 30, 2021).
Concentration Risk
Loan revenue comprises service charges and interest charges on outstanding loan balances. For the fiscal year ended
June 30, 2022, loan revenue of $239 million and $237 million from two countries were each in excess of ten percent
of total loan revenue.
The following table presents IDA’s loans outstanding and associated loan revenue by geographic region:
Table D8: Loan revenue and outstanding balance by geographic region
In millions of U.S. dollars
As of and for the fiscal years ended June 30,
2022
2021
Region
Service and
Interest Charges
b
Loans
Outstanding
Service and
Interest Charges
b
Loans
Outstanding
South Asia
$
727
$
61,062
$
676
$
64,141
Eastern and Southern Africa
444
48,863
639
48,508
Western and Central Africa
376
36,232
330
34,786
East Asia and Pacific
233
18,912
230
20,460
Europe and Central Asia
114
7,435
114
7,821
Latin America and the Caribbean
48
3,317
42
3,267
Middle East and North Africa
20
2,220
20
2,511
Others
a
1
50
1
10
Total
$
1,963
$
178,091
$
2,052
$
181,504
a. Represents loans under the PSW.
b. Excludes $3 million of interest rate swap expenses related to loan hedges ($2 million-June 30, 2021).

100 IDA FINANCIAL STATEMENTS: JUNE 30, 2022
NOTE E—BORROWINGS
IDA’s borrowings comprise CPL made by IDA members (carried at amortized cost) and market borrowings (carried
at amortized cost or fair value as described in Note A).
CPL are unsecured and unsubordinated fixed rate debt in SDR component currencies. IDA may prepay some or the
entire outstanding amounts without penalty. These borrowings are reported at amortized cost, and as of June 30,
2022, have original maturities of 25 and 40 years, with the final maturity in 2062. This does not include the proceeds
received under the grant component of the CPL, included in equity for which voting rights have been attributed.
Market borrowings are unsecured and unsubordinated debt in a variety of currencies. Some of these instruments are
callable. IDA has elected the fair value option for certain instruments. Overall market borrowings have original
maturities that range from 24 days to 20 years, with the final maturity in 2042.
IDA uses derivative contracts to manage the currency risk as well as the interest rate risk in the market borrowing
portfolio. For example, IDA may enter into derivative transactions to convert fixed rate bonds into floating rate
instruments. For details regarding the derivatives used in the borrowing portfolio, see Note F—Derivative
Instruments.
As of June 30, 2022, instruments in IDA’s borrowing portfolio measured at fair value were classified as Level 2,
within the fair value hierarchy. A summary of IDA’s borrowings are as follows (for details on principal due upon
maturity, see Note K—Fair Value Disclosures):
Table E1: Market borrowings outstanding, at fair value, after derivatives
In millions of U.S. dollars
June 30, 2022
June 30, 2021
Market borrowings
$
19,718
$
20,555
Currency swaps, net
547
(97)
Interest rate swaps, net
1,586
118
Total at fair value
$
21,851
$
20,576
Table E2: Market borrowings outstanding, at amortized cost
In millions of U.S dollars
Principal at face value
Net unamortized premium
(discount)
Total
June 30, 2022
$
6,240
$
(39)
$
6,201
June 30, 2021
$
-
$
-
$
-
Table E3: Concessional partner loans outstanding, at amortized cost
In millions of U.S dollars
Principal at face value
Net unamortized discount
Total
June 30, 2022
$
8,508
$
(1,528)
$
6,980
June 30, 2021
$
9,495
$
(1,736)
$
7,759

IDA FINANCIAL STATEMENTS: JUNE 30, 2022 101
The following table provides a summary of the interest rate characteristics of IDA’s borrowings:
Table E4: Borrowings-Interest rate composition before derivatives
In millions of U.S. dollars
June 30, 2022
WAC
a
(%)
June 30, 2021
WAC
a
(%)
Fixed
$
34,679
1.17
%
$
28,404
0.99
%
Variable
-
-
-
-
Borrowings
b
$
34,679
1.17
%
$
28,404
0.99
%
Fair Value Adjustment
(1,780)
(90)
Total Borrowings
$
32,899
$
28,314
a. WAC refers to weighted average borrowing cost as of the reporting date.
b. At amortized cost.
The currency composition of debt in IDA’s borrowing portfolio before derivatives was as follows:
Table E5: Borrowings-Currency composition before derivatives
June 30, 2022
June 30, 2021
Euro
30
%
18
%
Japanese yen
9
14
Pound sterling
18
17
U.S. dollar
40
49
Others
3
2
100
%
100
%
The maturity structure of IDA’s borrowings outstanding was as follows:
Table E6: Borrowings-Maturity structure
In millions of U.S. dollars
Period
June 30, 2022
June 30, 2021
Less than 1 year
$
5,677
$
4,724
1 - 2 years
135
1,713
2 - 3 years
2,331
146
3 - 4 years
3,847
2,837
4 - 5 years
2,667
4,154
Thereafter
19,809
16,476
Total
a
$
34,466
$
30,050
a. For June 30, 2022, total includes net unamortized discount of $1,528 million ($1,736 million—June 30, 2021) for CPL and $39
million (Nil—June 30, 2021) for market borrowings at amortized cost.
The following table provides information on the unrealized mark-to-market gains or losses on market borrowings
recorded at fair value included in the Statement of Income:
Table E7: Unrealized mark-to-market gains or losses relating to market borrowings recorded at fair value
In millions of U.S. dollars
Fiscal Year Ended June 30,
Reported as
2022
2021
2020
Unrealized mark-to-market gains (losses) on non-trading portfolios, net
$
1,713
$
318
$
(106)

102 IDA FINANCIAL STATEMENTS: JUNE 30, 2022
NOTE F—DERIVATIVE INSTRUMENTS
IDA uses derivative instruments in its investment, loan and borrowing portfolios, for asset/liability management
purposes, and to assist clients in managing risks.
The following table summarizes IDA’s use of derivatives in its various financial portfolios.
Table F1: Use of derivatives in various financial portfolios
Portfolio
Derivative instruments used
Purpose/Risk being managed
Risk management purposes:
Investments-Trading
Interest rate swaps, currency forward contracts,
currency swaps, options, swaptions, futures
contracts and TBA securities
Manage currency and interest rate risk in the
portfolio.
Other assets/liabilities
management
Currency forward contracts, currency swaps and
interest rate swaps
Manage currency and interest rate risks.
Loans
Interest rate swaps
Manage interest rate risk in the portfolio.
Borrowings
Interest rate swaps and currency swaps
Manage currency and interest rate risk in the
portfolio.
Other purposes:
Client operations
Structured swaps
Assist clients in managing risks.
The derivatives in the related tables of Note F are presented on a net basis by instrument. A reconciliation to the
Balance Sheet presentation is shown in table F2.
Offsetting assets and liabilities
IDA enters into International Swaps and Derivatives Association, Inc. (ISDA) master netting agreements with
substantially all of its derivative counterparties. These legally enforceable master netting agreements give IDA the
right to liquidate securities held as collateral and to offset receivables and payables with the same counterparty, in
the event of a default by the counterparty.
The following tables summarize the gross and net derivative positions by instrument type. Instruments that are in a
net asset position are included in the Derivative Assets columns and instruments that are in a net liability position
are included in the Derivative Liabilities columns. The gross columns represent the fair value of the instrument leg
that is in an asset or liability position that are then netted with the other leg of the instrument in the gross offset
columns. The effects of the master netting agreements are applied on a aggregate basis to the total derivative asset
and liability positions and are presented net of any cash collateral received on the Balance Sheet. The net derivative
asset positions in the tables below have been further reduced by any securities received as collateral to disclose
IDA’s net exposure on its derivative asset positions.

IDA FINANCIAL STATEMENTS: JUNE 30, 2022 103
Table F2: Derivatives assets and liabilities before and after netting adjustments
In millions of U.S. dollars
June 30, 2022
Derivative Assets
Derivative Liabilities
Gross
Amounts
Gross
Amounts
Offset
Net
Amounts
Gross
Amounts
Gross
Amounts
Offset
Net
Amounts
Interest rate swaps
$
3,267
$
(1,678)
$
1,589
$
2,321
$
(727)
$
1,594
Currency swaps
a
16,624
(15,355)
1,269
6,569
(5,918)
651
Total
$
19,891
$
(17,033)
$
2,858
$
8,890
$
(6,645)
$
2,245
Less:
Amounts subject to legally
enforceable master netting
agreements
$
1,682
b
$
1,666
c
Cash collateral received
772
Net derivative positions on the
Balance Sheet
`
$
404
$
579
Less:
Securities collateral received
-
Net derivative exposure after
collateral
$
404
Table F2.1
In millions of U.S. dollars
June 30, 2021
Derivative Assets
Derivative Liabilities
Gross
Amounts
Gross
Amounts
Offset
Net
Amounts
Gross
Amounts
Gross
Amounts
Offset
Net
Amounts
Interest rate swaps
$
1,105
$
(912)
$
193
$
1,886
$
(1,577)
$
309
Currency swaps
a
15,691
(15,231)
460
14,956
(14,449)
507
Total
$
16,796
$
(16,143)
$
653
$
16,842
$
(16,026)
$
816
Less:
Amounts subject to legally
enforceable master netting
agreements
$
404
b
$
408
c
Cash collateral received
-
Net derivative positions on the
Balance Sheet
249
408
Less:
Securities collateral received
-
Net derivative exposure after
collateral
$
249
a. Includes currency forward contracts.
b. Includes $35 million CVA adjustment ($2 million-June 30, 2021).
c. Includes $19 million DVA adjustment ($6 million-June 30, 2021).

104 IDA FINANCIAL STATEMENTS: JUNE 30, 2022
The following table provides information about the credit risk exposures, at the instrument level, of IDA’s derivative
instruments.
Table F3: Credit risk exposure of the derivative instruments:
In millions of U.S. dollars
June 30, 2022
Interest rate
swaps
Currency swaps
(including currency
forward contracts)
Total
Investments - Trading
$
2
$
306
$
308
Asset/liability management
1,513
963
2,476
Borrowings
2
-
2
Other
a
72
-
72
Total Exposure
$
1,589
$
1,269
$
2,858
Table F3.1
In millions of U.S. dollars
June 30, 2021
Interest rate
swaps
Currency swaps
(including currency
forward contracts)
Total
Investments - Trading
$
-
$
167
$
167
Asset/liability management
78
176
254
Borrowings
103
111
214
Other
a
12
6
18
Total Exposure
$
193
$
460
$
653
a. Includes derivatives related to loans and PSW.
The volume of derivative contracts is measured using the U.S. dollar equivalent notional balance. The notional
balance represents the face value or reference value on which the calculations of payments on the derivative
instrument are determined. As of June 30, 2022, the notional amounts of IDA’s derivative contracts outstanding
were as follows: interest rate swaps $33,267 million ($33,432 million as of June 30, 2021), currency swaps $23,120
million ($30,349 million as of June 30, 2021). There were no long or short positions of other derivatives as of June
30, 2022 (Nil— June 30, 2021).
Collateral: IDA is not required to post collateral under its derivative agreements as long as it maintains a triple-A
credit rating. The aggregate fair value of all derivative instruments with credit-risk related contingent features that
are in a liability position as of June 30, 2022 is $586 million ($414 million —June 30, 2021). As of June 30, 2022,
IDA was not required to post any collateral in accordance with the relevant agreements.
If the credit-risk related contingent features underlying these agreements were triggered to the extent that IDA
would be required to post collateral as of June 30, 2022, the amount of collateral that would need to be posted
would be $41 million ($25 million—June 30, 2021). Subsequent triggers of contingent features would require
posting of additional collateral, up to a maximum of $586 million as of June 30, 2022 ($414 million—June 30,
2021).
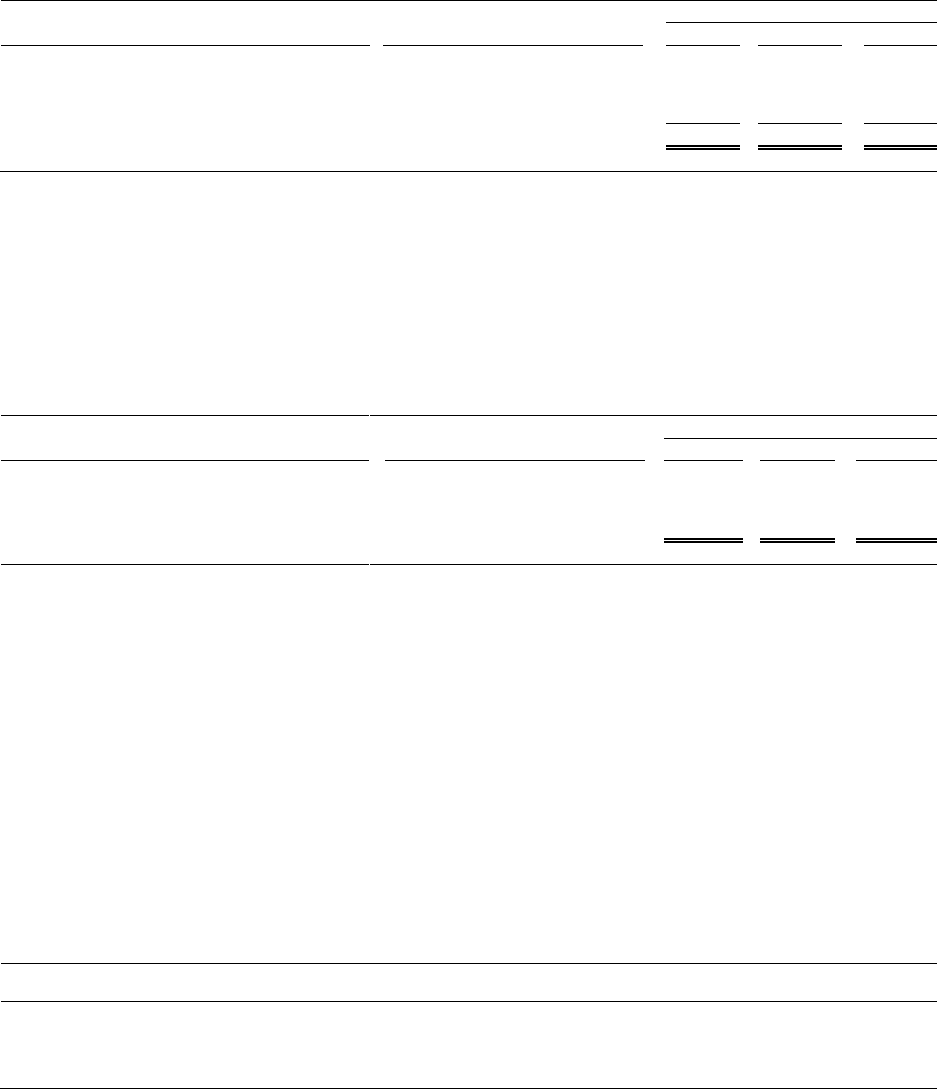
IDA FINANCIAL STATEMENTS: JUNE 30, 2022 105
The gains and losses on the non-trading derivatives, by instrument type and their location in the Statement of
Income are as follows:
Table F4: Unrealized mark-to-market gains or losses on non-trading derivatives
In millions of U.S. dollars
Fiscal Year Ended June 30,
Type of instrument
Reported as
2022
2021
2020
Interest rate swaps
Unrealized mark-to-market
(losses) gains on Non-Trading
portfolios, net
80
898
(996)
Currency forward contracts and currency swaps
(293)
(101)
385
Total
$
(213)
$
797
$
(611)
The majority of the instruments in IDA’s investment portfolio are held for trading purposes. Within the trading
portfolio, IDA holds highly rated fixed income instruments as well as derivatives. The trading portfolio is primarily
held to ensure the availability of funds to meet future cash flow requirements and for liquidity management
purposes.
The following table provides information on the amount of gains and losses on IDA’s investment trading portfolio
(derivative and non-derivative instruments), and their location in the Statement of Income:
Table F5: Unrealized mark-to-market gains or losses on Investments-Trading portfolio
In millions of U.S. dollars
Fiscal Year Ended June 30,
Type of instrument
a
Reported as
2022
2021
2020
Fixed income (including related derivatives)
Unrealized mark-to-market
(losses) gains on Investments-
Trading portfolio, net
$
(104)
$
144
$
207
a. Amounts associated with each type of instrument includes gains and losses on both derivative instruments and non-derivative
instruments.
NOTE G—TRANSACTIONS WITH AFFILIATED ORGANIZATIONS
IDA transacts with affiliated organizations as a recipient of transfers and grants, administrative and derivative
intermediation services, and through cost sharing of IBRD’s sponsored pension and other postretirement benefit
plans.
On October 14, 2021, IBRD’s Board of Governors approved a transfer of $274 million to IDA. This transfer was
received on October 25, 2021.
Transfers and Grants
Cumulative transfers and grants made to IDA as of June 30, 2022 were $20,476 million ($20,202 million—June 30,
2021). Details by transferor are as follows:
Table G1: Transfers and grants
In millions of U.S. dollars
Transfers from
Beginning of the
fiscal year
Transfers during
the fiscal year
End of the fiscal
year
Total
$
20,202
$
274
$
20,476
Of which transfers from:
IBRD
16,087
274
16,361
IFC
3,885
-
3,885

106 IDA FINANCIAL STATEMENTS: JUNE 30, 2022
Receivables and Payables
The total amounts receivable from (payable to) affiliated organizations is comprised of the following:
Table G2: IDA’s receivables and payables with affiliated organizations
In millions of U.S. dollars
June 30, 2022
June 30, 2021
IBRD
IFC
Total
IBRD
IFC
Total
Administrative Services, net
a
$
(174)
$
-
$
(174)
$
(268)
$
-
$
(268)
Derivative (liabilities)/assets, net
(8)
(9)
(17)
(8)
4
(4)
PSW-Blended Finance Facility
b
-
54
54
-
41
41
Pension and Other
Postretirement Benefits
602
-
602
572
-
572
Investments
-
346
346
-
487
487
$
420
$
391
$
811
$
296
$
532
$
828
a. Includes receivable of $404 million for the fiscal year ended June 30, 2022 ($293 million-June 30, 2021) from IBRD for IDA's
share of investments associated with Post-Retirement Contribution Reserve Fund (PCRF), which is a fund established to stabilize
contributions made to the pension plans.
b. Refer to Table G4: Summary of PSW-related transactions.
The receivables from (payables to) these affiliated organizations are reported on the Balance Sheet as follows:
Receivables / Payables related to:
Reported as:
Receivable for pension and other postretirement benefits
Receivable from affiliated organization
Net receivables (payables) for derivative transactions
Derivative assets/liabilities, net
Payable for administrative services
a
Payable to affiliated organization
Receivable for PSW – Blended Finance Facility
Other Assets
Receivable for Investments
Investments
a. Includes amounts receivable from IBRD for IDA’s share of investments associated with PCRF. This receivable is included in
Receivable from affiliated organization on the Balance Sheet.
Administrative Services
The payable to IBRD represents IDA’s share of joint administrative expenses, including contributions to special
programs and IDA’s share of investments associated with PCRF, net of other revenue jointly earned. The allocation
of expenses is based upon an agreed cost sharing formula, and amounts are settled quarterly.
During the fiscal year ended June 30, 2022, IDA’s share of joint administrative expenses and contributions to special
programs totaled $1,644 million ($1,873 million—fiscal year ended June 30, 2021 and $1,824 million—fiscal year
ended June 30, 2020). This amount excludes IDA-executed trust fund expenses of $613 million ($553 million—
fiscal year ended June 30, 2021 and $586 million—fiscal year ended June 30, 2020).
Other revenue
IDA’s share of other revenue jointly earned with IBRD during the fiscal year ended June 30, 2022 totaled $252
million ($261 million—fiscal year ended June 30, 2021 and $316 million—fiscal year ended June 30, 2020). This
amount excludes IDA-executed trust fund revenue of $613 million ($553 million—fiscal year ended June 30, 2021
and $586 million—fiscal year ended June 30, 2020).
The amount of fee revenue associated with services provided to other affiliated organizations is included in Other
revenue in the Statement of Income, as follows:
Table G3: Fee revenue from affiliated organizations
In millions of U.S. dollars
Fiscal Year Ended June 30,
2022
2021
2020
Fees charged to IFC
$
84
$
77
$
80
Fees charged to MIGA
5
5
5
IDA FINANCIAL STATEMENTS: JUNE 30, 2022 107
Pension and Other Postretirement Benefits
The staff of IBRD perform functions for both IBRD and IDA, but all staff compensation is paid directly by IBRD.
Accordingly, a portion of IBRD's staff and associated administrative costs is allocated to IDA based on an agreed
cost sharing ratio using various indicators. The methodology for computing this share ratio is approved by the
Executive Directors for both institutions.
IBRD, along with IFC and MIGA, sponsors a defined benefit Staff Retirement Plan and Trust (SRP), the Retired
Staff Benefits Plan and Trust (RSBP) and the Post-Employment Benefits Plan (PEBP) that cover substantially all of
their staff members.
The SRP provides regular defined pension benefits and also includes a cash balance component. The RSBP provides
certain health and life insurance benefits to eligible retirees. The PEBP provides certain pension benefits
administered outside the SRP.
June 30 is used as the measurement date for these pension and other postretirement benefit plans. All costs, assets
and liabilities associated with these plans are allocated between IBRD, IFC, and MIGA based upon their employees’
respective participation in the plans.
While IDA is not a participating entity to these benefit plans, IDA shares in the costs and reimburses IBRD for its
proportionate share of any contributions made to these plans by IBRD. During the fiscal year ended June 30, 2022,
IDA’s share of IBRD’s costs relating to all the three plans totaled $191 million ($494 million—fiscal year ended
June 30, 2021 and $357 million—fiscal year ended June 30, 2020).
The receivable from IBRD represents IDA’s net share of prepaid costs for pension and other postretirement benefit
plans and PEBP assets. These will be realized over the lives of the plan participants.
The cost of any potential future liability arising from these plans would be shared by IBRD and IDA using the
applicable share ratio. As of June 30, 2022, the SRP and the RSBP were overfunded by $1,914 million and $395
million, respectively. The PEBP, after reflecting IBRD and IDA’s share of assets which are included in IBRD’s
investment portfolio of $1,791 million, was underfunded by $316 million.
Derivative transactions
IDA enters into currency forward contracts with IBRD acting as the intermediary with the market, primarily to
convert donors’ expected contributions in national currencies under the Sixteenth and Seventeenth replenishments of
IDA’s resources into the five currencies of the SDR basket.
Investments – Non-trading
During the fiscal year ended June 30, 2015, IDA purchased a debt security issued by IFC for a principal amount of
$1,179 million, amortizing over a period of 25 years. The investment carries a fixed interest rate of 1.84% and has a
weighted average maturity of 3 years. As of June 30, 2022, the principal amount due on the debt security was $358
million ($472 million—June 30, 2021), and it had a fair value of $346 million ($487 million—June 30, 2021). The
investment is reported under Investments on the Balance Sheet. During the fiscal year ended June 30, 2022, IDA
recognized interest income of $8 million from this investment ($10 million— fiscal year ended June 30, 2021 and
$12 million— fiscal year ended June 30, 2020).
Private Sector Window
The PSW was created under the Eighteenth Replenishment of IDA’s Resources (IDA18), which became effective
beginning fiscal year ended June 30, 2018, to mobilize private sector investment in IDA-only countries and IDA-
eligible Fragile and Conflict-affected States. In IDA18, PSW allocation, net of cancellation, was $1.3 billion which
was fully committed. The PSW continued under IDA’s Nineteenth Replenishment of Resources (IDA19), which
became effective beginning fiscal year ending June 30, 2021, with an initial allocation set at $2.5 billion which was
revised to $1.7 billion. Under the fee arrangement for the PSW, IDA receives fee income for transactions executed
under this window and reimburses IFC and MIGA for the related costs incurred in administering these transactions.

108 IDA FINANCIAL STATEMENTS: JUNE 30, 2022
The following tables provide a summary of all PSW related transactions under which IDA had an exposure as of
June 30, 2022:
Table G4: Summary of PSW related transactions
In millions of U.S. dollars
Facility
Notional
Net Asset/
(Liability) position
Description
Location on the Balance Sheet
Local Currency
Facility
$
132
$
(9)
Currency swaps with IFC to support
local currency denominated loans
Derivative assets/ liabilities,
net
In millions of U.S. dollars
Facility
Exposure
Accumulated
Provision
Description
Location on the Balance Sheet
Exposure
Accumulated
Provision
MIGA Guarantee
Facility
$
272
$
37
Expanding the coverage of MIGA
Political Risk Insurance (PRI)
products through shared first-loss or
risk participation similar to
reinsurance
Off Balance
Sheet item
Other liabilities
Blended Finance
Facility
$
366
$
55
Sharing the coverage of IFC
programs through shared first loss
Off Balance
Sheet item
Other liabilities
54
Not applicable
Funding for IFC's PSW equity
investments
Other assets
50
7
Concessional senior & sub-
ordinated loans to support medium
term projects
Loans
outstanding
Accumulated
Provision for
Loan Losses
NOTE H—TRUST FUNDS ADMINISTRATION
IDA, alone or jointly with one or more of its affiliated organizations, administers on behalf of the donors, including
members, their agencies and other entities, funds restricted for specific uses in accordance with administration
agreements with the donors. Specified uses of the funds include, among others, co-financing of IDA lending
projects, debt reduction operations for IDA members, technical assistance for borrowers including feasibility studies
and project preparation, global and regional programs, and research and training programs. These funds are held in
trust by IDA and/or IBRD, and are held in a separate investment portfolio which is not commingled with IDA and/or
IBRD funds.
Trust fund execution may be carried out in one of two ways: Recipient-executed or IDA-executed.
Recipient-executed trust funds involve activities carried out by a recipient third-party executing agency. IDA enters
into agreements with and disburses funds to such recipients, who then exercise spending authority to meet the
objectives and comply with terms stipulated in the agreements.
IDA-executed trust funds involve execution of activities by IDA as described in relevant administration agreements
with donors, which define the terms and conditions for use of the funds. Spending authority is exercised by IDA,
under the terms of the administration agreements. The executing agency services provided by IDA include, among
others, activity preparation, analytical and advisory activities and project-related activities, including procurement of
goods and services.
The following table summarizes the expenses pertaining to IDA-executed trust funds:
Table H1: Expenses pertaining to IDA-executed trust funds
In millions of U.S. dollars
Fiscal Year Ended June 30,
2022
2021
2020
IDA-executed trust funds expenses
$
613
$
553
$
586

IDA FINANCIAL STATEMENTS: JUNE 30, 2022 109
These amounts are included in Administrative expenses and the corresponding revenue is included in Revenue from
externally funded activities in the Statement of Income. Administrative expenses primarily relate to staff cost, travel
and consultant fees.
The following table summarizes undisbursed contributions made by third party donors to IDA-executed trust funds,
recognized on the Balance Sheet:
Table H2: Undisbursed contributions made by third party donors to IDA-executed trust funds
In millions of U.S. dollars
June 30, 2022
June 30, 2021
IDA-executed trust funds
$
707
$
749
These amounts are included in Other Assets and the corresponding liabilities are included in Accounts payable and
miscellaneous liabilities on the Balance Sheet.
Revenues
IDA’s revenues for the administration of trust fund operations were as follows:
Table H3: IDA’s revenues for the administration of trust fund operations
In millions of U.S. dollars
Fiscal Year Ended June 30,
2022
2021
2020
Revenues
$
43
$
38
$
41
These amounts are included in Other non-interest revenue in the Statement of Income.
Amounts collected from donor contributions for administration activities, but not yet earned, totaling $67 million at
June 30, 2022 ($70 million—June 30, 2021) are included in Other Assets and in Accounts payable and
miscellaneous liabilities, respectively, on the Balance Sheet.
Transfers Received
Under the agreements governing the administration of certain trust funds, IDA may receive any surplus assets as
transfers upon the termination of these trust funds. In addition, as loans are repaid to trust funds, in certain cases the
repayments are transferred to IDA. During the fiscal year ended June 30, 2022, no funds were recorded as Transfers
from affiliated organizations and others, under these arrangements (Nil—fiscal year ended June 30, 2021 and Nil—
fiscal year ended June 30, 2020).

110 IDA FINANCIAL STATEMENTS: JUNE 30, 2022
NOTE I—DEVELOPMENT GRANTS
A summary of changes to the amounts payable for unconditional development grants is presented below:
Table I1: Grants payable
In millions of U.S. dollars
June 30, 2022
June 30, 2021
Balance, beginning of the fiscal year
$
6,820
$
9,141
Disbursement (including PPA grant activity)
a
(1,659)
(2,417)
Cancellations
(149)
(235)
Translation adjustment
(397)
331
Balance, end of the fiscal year
$
4,615
$
6,820
a. Project Preparation Advances (PPA).
A summary of the development grant expenses is presented below:
Table I2: Grant activity
In millions of U.S dollars
Fiscal Year Ended June 30,
2022
2021
Conditional development grants disbursed
a
$
3,736
$
3,829
Cancellation of unconditional grants
(149)
(235)
Disbursement of grant advances not yet expensed
b
(1,949)
(1,033)
Grant advances meeting expense condition
c
734
269
Grant Expenses
$
2,372
$
2,830
Grants Approved
$
13,083
$
12,192
a. Disbursements of conditional grants approved on or after July 1, 2019
b. Disbursements made over the period for which the expense recognition criteria has not yet been met.
c. Prior disbursement of grant advances meeting the criteria to be expensed over the period.
As of June 30, 2022, the cumulative amount of conditional grants approved but not yet expensed was $24,384
million. Out of which, the outstanding amount of conditional grant advances disbursed but not yet expensed, totaling
$2,189 million at June 30, 2022 ($974 million – June 30, 2021), are included in Other assets on the Balance Sheet.
NOTE J—ACCUMULATED OTHER COMPREHENSIVE INCOME
Comprehensive income consists of net income (loss) and other gains and losses affecting equity that, under U.S.
GAAP, are excluded from net income (loss). Other comprehensive income (loss) is comprised of currency
translation adjustments on functional currencies and DVA on fair value option elected liabilities. These items are
presented in the Statement of Comprehensive Income.
The following table presents the changes in Accumulated Other Comprehensive (Loss) Income (AOCI) balances:
Table J1: Changes in accumulated other comprehensive income (loss)
In millions of U.S. dollars
Fiscal Year Ended June 30,
2022
2021
2020
Balance, beginning of the fiscal year
$
1,656
$
(3,927)
$
(2,408)
Currency translation adjustments on functional currencies
(10,851)
5,647
(1,526)
DVA on fair value option elected liabilities
43
(64)
7
Balance, end of the fiscal year
$
(9,152)
$
1,656
$
(3,927)
IDA FINANCIAL STATEMENTS: JUNE 30, 2022 111
NOTE K—FAIR VALUE DISCLOSURES
Valuation Methods and Assumptions
As of June 30, 2022, and June 30, 2021, IDA had no financial assets or liabilities measured at fair value on a non–
recurring basis.
Due from Banks
The carrying amount of unrestricted and restricted cash is considered a reasonable estimate of the fair value of these
positions.
Loans and loan commitments
There were no loans carried at fair value as of June 30, 2022 and June 30, 2021. IDA’s loans and loan commitments
would be classified as Level 3 within the fair value hierarchy.
Summarized below are the techniques applied in determining the fair values of IDA’s financial instruments.
Investment securities
Where available, quoted market prices are used to determine the fair value of trading securities. Examples include
most government and agency securities and futures contracts.
For instruments for which market quotations are not available, fair values are determined using model-based
valuation techniques, whether internally-generated or vendor-supplied, that include the standard discounted cash
flow method using observable market inputs such as yield curves, credit spreads, and constant prepayment spreads.
Where applicable, unobservable inputs such as conditional prepayment rates, probability of default, and loss severity
are used.
Unless quoted prices are available, time deposits are reported at face value, which approximates fair value, as they
are short term in nature.
Securities purchased under resale agreements, securities sold under repurchase agreements, and securities lent
under securities lending agreements
These securities are of a short-term nature and are reported at face value, which approximates fair value.
Borrowings
The fair value of IDA’s borrowings carried at fair value is calculated using a discounted cash flow method which
relies on observable market inputs such as yield curves, foreign exchange rates, basis spreads and funding spreads.
As of June 30, 2022, and June 30, 2021, borrowings measured at amortized cost would be classified as Level 2
within the fair value hierarchy.
Derivative instruments
Derivative contracts include currency forward contracts, TBA securities, swaptions, exchange traded options and
futures contracts, currency swaps and interest rate swaps.
Where available, quoted market prices are used to determine the fair value of trading securities. Examples include
exchange traded options and futures contracts.
For instruments for which market quotations are not available, fair values are determined using model-based
valuation techniques, whether internally-generated or vendor-supplied, that include the standard discounted cash
flow method using observable market inputs such as yield curves, foreign exchange rates, credit spreads, basis
spreads, funding spreads and constant prepayment spreads. Where applicable, unobservable inputs such as constant
prepayment rates, probability of default, and loss severity are used.
Valuation adjustments on fair value option elected liabilities
The DVA on fair value option elected liabilities (market borrowings carried at fair value) is measured by revaluing
each liability to determine the changes in fair value of that liability arising from changes in IDA’s cost of funding
applicable to the relevant reference rates.

112 IDA FINANCIAL STATEMENTS: JUNE 30, 2022
The table below presents IDA’s estimates of fair value of its financial assets and liabilities along with their
respective carrying amounts.
Table K1: Fair value and carrying amounts of financial assets and liabilities
In millions of U.S dollars
June 30, 2022
June 30, 2021
Carrying Value
Fair Value
Carrying Value
Fair Value
Assets
Due from banks
$
686
$
686
$
496
$
496
Investments (including securities transferred
under repurchase or securities lending
agreements)
39,827
39,827
37,376
37,376
Net loans outstanding
174,490
141,193
177,779
164,606
Derivative assets, net
404
404
249
249
Liabilities
Borrowings
Market borrowings, at fair value
19,718
19,718
20,555
20,555
Market borrowings, at amortized cost
6,201
5,073
-
-
Concessional partner loans
6,980
7,123
7,759
9,516
Derivative liabilities, net
579
579
408
408
As of June 30, 2022, IDA’s signed loan commitments were $61.8 billion ($60.8 billion – June 30, 2021) and had a
fair value of $(8.2) billion ($(5.4) billion - June 30, 2021).

IDA FINANCIAL STATEMENTS: JUNE 30, 2022 113
The following tables present IDA’s fair value hierarchy for assets and liabilities measured at fair value on a
recurring basis.
Table K2: Fair value hierarchy of IDA’s assets and liabilities
In millions of U.S. dollars
Fair Value Measurements on a Recurring Basis
As of June 30, 2022
Level 1
Level 2
Level 3
Total
Assets:
Investments—Trading
Government and agency obligations
$
7,699
$
16,203
$
-
$
23,902
Time deposits
569
14,842
-
15,411
ABS
-
168
-
168
Total Investments—Trading
8,268
31,213
-
39,481
Investments—Non-trading (at fair value)
-
346
-
346
Total Investments
$
8,268
$
31,559
$
-
$
39,827
Derivative assets:
Currency swaps and currency forward contracts
$
-
$
1,269
$
-
$
1,269
Interest rate swaps
-
1,589
-
1,589
$
-
$
2,858
$
-
$
2,858
Less:
Amounts subject to legally enforceable master netting agreements
a
1,682
Cash collateral received
772
Derivative assets, net
$
404
Liabilities:
Market Borrowings, at fair value
$
-
$
19,718
$
-
$
19,718
Derivative liabilities:
Currency swaps and currency forward contracts
$
-
$
651
$
-
$
651
Interest rate swaps
-
1,594
-
1,594
$
-
$
2,245
$
-
$
2,245
Less:
Amounts subject to legally enforceable master netting agreements
b
1,666
Derivative liabilities, net
$
579
a. Includes $35 million CVA.
b. Includes $19 million DVA.

114 IDA FINANCIAL STATEMENTS: JUNE 30, 2022
Table K2.1
In millions of U.S. dollars
Fair Value Measurements on a Recurring Basis
As of June 30, 2021
Level 1
Level 2
Level 3
Total
Assets:
Investments—Trading
Government and agency obligations
$
7,852
$
17,425
$
-
$
25,277
Time deposits
728
10,732
-
11,460
ABS
-
152
-
152
Total Investments—Trading
8,580
28,309
-
36,889
Investments—Non-trading (at fair value)
-
487
-
487
Total Investments
$
8,580
$
28,796
$
-
$
37,376
Derivative assets:
Currency swaps and currency forward contracts
$
-
$
460
$
-
$
460
Interest rate swaps
-
193
-
193
$
-
$
653
$
-
$
653
Less:
Amounts subject to legally enforceable master netting agreements
a
404
Cash collateral received
-
Derivative assets, net
$
249
Liabilities:
Market Borrowings
$
-
$
20,555
$
-
$
20,555
Derivative liabilities:
Currency swaps and currency forward contracts
$
-
$
507
$
-
$
507
Interest rate swaps
-
309
-
309
$
-
$
816
$
-
$
816
Less:
Amounts subject to legally enforceable master netting agreements
b
408
Derivative liabilities, net
$
408
a. Includes $2 million CVA.
b. Includes $6 million DVA.

IDA FINANCIAL STATEMENTS: JUNE 30, 2022 115
Presented below is the difference between the aggregate fair value and aggregate contractual principal balance of
non-trading securities in the investment portfolio:
Table K3: Investment portfolio-Non-trading securities
In millions of U.S dollars
Fair value
Principal amount due
Difference
June 30, 2022
$
346
$
358
$
(12)
June 30, 2021
$
487
$
472
$
15
Presented below is the difference between the aggregate fair value and aggregate contractual principal balance of
market borrowings:
Table K4: Market Borrowings-Fair value and contractual principal balance
In millions of U.S. dollars
Fair Value
Principal Due Upon
Maturity
Difference
June 30, 2022
$
19,718
$
21,506
$
(1,788)
June 30, 2021
$
20,555
$
20,659
$
(104)
Valuation adjustments on fair value option elected liabilities
During the fiscal year ended June 30, 2022, IDA recorded unrealized mark-to-market gain of $43 million ($64
million unrealized mark-to-market loss – fiscal year ended June 30, 2021) in Other Comprehensive Income, in
relation to the changes in its own credit (DVA) on fair value option elected liabilities (market borrowings carried at
fair value).
As of June 30, 2022, IDA’s Balance Sheet included a DVA of $13 million cumulative loss ($56 million cumulative
loss—June 30, 2021) in Accumulated other comprehensive income, associated with the changes in IDA’s own credit
for its market borrowings reported at fair value.

116 IDA FINANCIAL STATEMENTS: JUNE 30, 2022
The following table reflects the components of the unrealized mark-to-market gains or losses on IDA’s trading and
non-trading portfolios, net.
Table K5: Unrealized mark-to-market gains (losses) on trading and non-trading portfolios, net
In millions of U.S. dollars
Fiscal Year Ended June 30, 2022
Realized gains
(losses)
Unrealized gains
(losses) excluding
realized amounts
a
Unrealized gains
(losses)
Investments- Trading—Note F
$
407
$
(511)
$
(104)
Non-trading portfolios, net
Asset-liability management—Note F
-
1,441
1,441
Other Non-trading portfolios
Investment portfolio—Note C
-
(26)
(26)
Borrowing portfolio—Note E
-
(2)
(2)
Other
b
-
61
61
Total
$
-
$
1,474
$
1,474
Table K5.1:
In millions of U.S. dollars
Fiscal Year Ended June 30, 2021
Realized gains (losses)
Unrealized gains
(losses) excluding
realized amounts
a
Unrealized gains
(losses)
Investments- Trading—Note F
$
185
$
(41)
$
144
Non-trading portfolios, net
Asset-liability management—Note F
-
1,080
1,080
Other Non-trading portfolios
Investment portfolio—Note C
-
(12)
(12)
Borrowing portfolio—Note E
-
15
15
Other
b
-
19
19
Total
$
-
$
1,102
$
1,102
Table K5.2:
In millions of U.S. dollars
Fiscal Year Ended June 30, 2020
Realized gains (losses)
Unrealized gains
(losses) excluding
realized amounts
a
Unrealized gains
(losses)
Investments- Trading—Note F
$
207
$
-
$
207
Non-trading portfolios, net
Asset-liability management—Note F
-
(699)
(699)
Other Non-trading portfolios
Investment portfolio—Note C
-
29
29
Borrowing portfolio—Note E
-
(13)
(13)
Other
b
-
(5)
(5)
Total
$
-
$
(688)
$
(688)
a. Adjusted to exclude amounts reclassified to realized gains/losses.
b. Other comprises mark to market gains or losses on the loan portfolio and on PSW.
IDA FINANCIAL STATEMENTS: JUNE 30, 2022 117
NOTE L—CONTINGENCIES
Due to the ongoing COVID-19 pandemic, IDA faces additional credit, market, and operational risks. The length and
severity of the pandemic and the related developments, as well as the impact on the financial results and position of
IDA in future periods cannot be reasonably estimated at this point in time and continue to evolve. IDA continues to
monitor the developments and to manage the risks associated with its various portfolios within existing financial
policies and limits.
From time to time, IDA may be named as a defendant or co-defendant in legal actions on different grounds in
various jurisdictions. The outcome of any existing legal action, in which IDA has been named as a defendant or co-
defendant, as of and for the fiscal year ended June 30, 2022, is not expected to have a material adverse effect on
IDA's financial position, results of operations or cash flows.
